Introduction to GRADE Handbook
Handbook for grading the quality of evidence and the strength of recommendations using the GRADE approach. Updated October 2013.
Editors: Holger Schünemann (schuneh@mcmaster.ca), Jan Brożek (brozekj@mcmaster.ca), Gordon Guyatt (guyatt@mcmaster.ca), and Andrew Oxman (oxman@online.no)
1. Overview of the GRADE Approach
1.1 Purpose and advantages of the GRADE approach
1.2 Separation of confidence in effect estimates from strength of recommendations
1.3 Special challenges in applying the the GRADE approach
1.4 Modifications to the GRADE approach
2. Framing the health care question
2.1 Defining the patient population and intervention
2.2 Dealing with multiple comparators
2.4 Format of health care questions using the GRADE approach
3. Selecting and rating the importance of outcomes
3.1 Steps for considering the relative importance of outcomes
3.3 Using evidence in rating the importance of outcomes
3.4 Surrogate (substitute) outcomes
5.1 Factors determining the quality of evidence
5.2 Factors that can reduce the quality of the evidence
5.2.1 Study limitations (Risk of Bias)
5.2.2 Inconsistency of results
5.2.2.1 Deciding whether to use estimates from a subgroup analysis
5.2.3 Indirectness of evidence
5.2.4.1 Imprecision in guidelines
5.2.4.2 Imprecision in in systematic reviews
5.2.4.3 Rating down two levels for imprecision
5.3. Factors that can increase the quality of the evidence
5.3.1 Large magnitude of an effect
5.3.3. Effect of plausible residual confounding
5.4 Overall quality of evidence
6. Going from evidence to recommendations
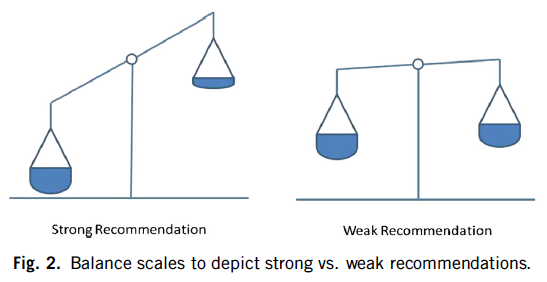
6.1 Recommendations and their strength
6.1.3 Recommendations to use interventions only in research
6.2 Factors determining direction and strength of recommendations
6.2.1 Balance of desirable and undesirable consequences
6.2.1.1 Estimates of the magnitude of the desirable and undesirable effects
6.2.1.2 Best estimates of values and preferences
6.3.2 Confidence in best estimates of magnitude of effects (quality of evidence)
6.3.3 Confidence in values and preferences
6.3.4.1 Differences between costs and other outcomes
6.3.4.3 Resource implications considered
6.3.4.4 Confidence in the estimates of resource use (quality of the evidence about cost)
6.3.4.5 Presentation of resource use
6.3.4.7 Consideration of resource use in recommendations
6.4 Presentation of recommendations
6.4.1 Wording of recommandations
6.4.3 Providing transparent statements about assumed values and preferences
6.5 The Evidence-to-Decision framework
7. The GRADE approach for diagnostic tests and strategies
7.1. Questions about diagnostic tests
7.1.1. Establishing the purpose of a test
7.1.2. Establishing the role of a test
7.1.3. Clear clinical questions
7.2. Gold standard and reference test
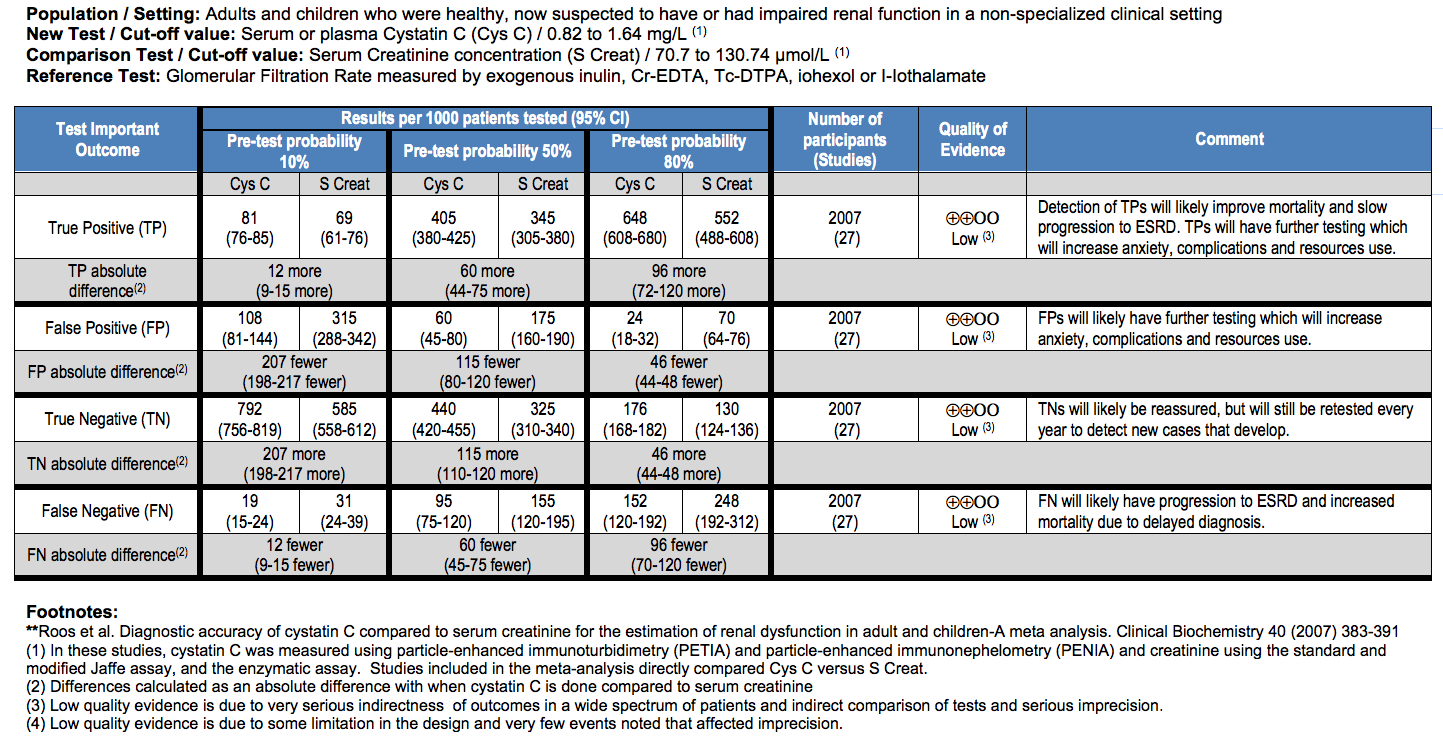
7.3. Estimating impact on patients
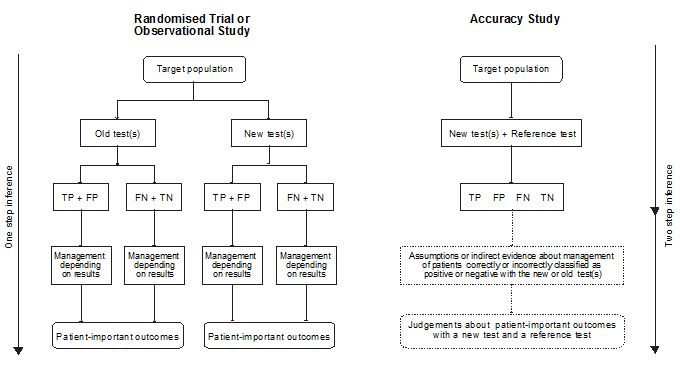
7.4. Indirect evidence and impact on patient-important outcomes
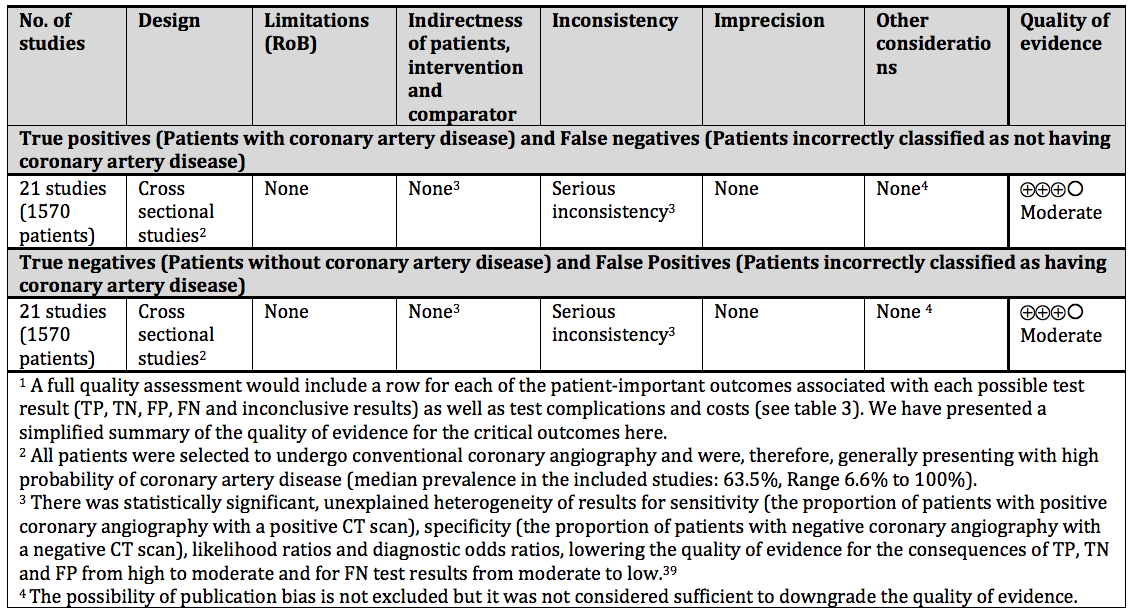
7.5. Judgment about the quality of the underlying evidence
7.5.2. Factors that determine and can decrease the quality of evidence
7.5.2.2. Indirectness of the evidence
7.5.3. Overall confidence in estimates of effects
8. Criteria for determining whether the GRADE approach was used
About the Handbook
Important disclaimer: Please note that this Handbook is being replaced by the GRADE Book, accessible since 2024 via book.gradepro.org. While this handbook has not been withdrawn as some sections have not appeared yet in the new GRADE Book, it will be phased out. Outdated sections in this handbook - that is sections that have been rewritten for the GRADE Book - are labelled accordingly at the beginning of each chapter with a link to the new GRADE Book chapter.
The GRADE handbook describes the process of rating the quality of the best available evidence and developing health care recommendations following the approach proposed by the Grading of Recommendations, Assessment, Development and Evaluation (GRADE) Working Group (www.gradeworkinggroup.org). The Working Group is a collaboration of health care methodologists, guideline developers, clinicians, health services researchers, health economists, public health officers and other interested members. Beginning in the year 2000, the working group developed, evaluated and implemented a common, transparent and sensible approach to grading the quality of evidence and strength of recommendations in health care. The group interacts through meetings by producing methodological guidance, developing evidence syntheses and guidelines. Members collaborate on research projects, such as the DECIDE project (www.decide-collaboration.eu) with other members and other scientists or organizations (e.g. www.rarebestpractices.eu). Membership is open and free. See www.gradeworkinggroup.org and Chapter The GRADE working group in this handbook for more information about the Working Group and a list of the organizations that have endorsed and adopted the GRADE approach.
The handbook is intended to be used as a guide by those responsible for using the GRADE approach to produce GRADE's output, which includes evidence summaries and graded recommendations. Target users of the handbook are systematic review and health technology assessment (HTA) authors, guideline panelists and methodologists who provide support for guideline panels. While many of the examples offered in the handbook are clinical examples, we also aimed to include a broader range of examples from public health and health policy. Finally, specific sections refer to interpreting recommendations for users of recommendations.
Using the Handbook
The handbook is divided into chapters that correspond to the steps of applying the GRADE approach. The Chapter Overview of the GRADE approach provides a brief overview of guideline development processes and where the GRADE approach fits in. Chapters Framing the health care question and Selecting and rating the importance of outcomes provide guidance on formulating health care questions for guidelines and systematic reviews and for rating the importance of outcomes in guidelines. The Chapter Summarizing the evidence covers evidence summaries produced using the GRADE software. GRADE acknowledges that alternative terms or expressions to what GRADE called quality of evidence are often appropriate. Therefore, we interpret and will use the phrases quality of evidence, strength of evidence, certainty in evidence or confidence in estimates interchangeably. When GRADE uses the phrase “confidence in estimates” it does not refer to statistical confidence intervals, although the width of this interval is part of the considerations for judging the GRADE criterion imprecision. When GRADE refers to confidence in the estimates it refers to the how certain one can be that the effect estimates are adequate to support a recommendation (in the context of guideline development) or that the effect estimate is close to that of the true effect (in the context of evidence synthesis). Chapter Quality of evidence provides instructions for rating the evidence and addresses the five factors outlined in the GRADE approach that may result in rating down the quality of evidence and the three factors that may increase the quality of evidence. Chapter Going from evidence to recommendations deals with moving from evidence to recommendations in guidelines and whether to classify recommendations as strong or weak according to the criteria outlined in the GRADE evidence to recommendation frameworks. The Chapter The GRADE approach for diagnostic tests and strategies addresses how to use the GRADE approach specifically for questions about diagnostic tests and strategies. Finally, the Chapter Criteria for determining whether the GRADE approach was used provides the suggested criteria that should be met in order to state that the GRADE approach was used.
Throughout the handbook certain terms and concepts are hyperlinked to access definitions and the specific sections elaborating on those concepts. The glossary of terms and concepts is provided in the Chapter Glossary of terms and concepts. Where applicable, the handbook highlights guidance that is specific to guideline developers or to systematic review authors as well as important notes pertaining to specific topics. HTA practitioners, depending on their mandate, can decide which approach is more suitable for their goals. Furthermore, examples demonstrating the application of the concepts are provided for each topic. The examples are cited if readers wish to learn more about them from the source documents.
Updating the Handbook
The handbook is updated to reflect advances in the GRADE approach and based on feedback from handbook users. It includes information from the published documents about the GRADE approach, which are listed in the Chapter Articles about GRADE, and links to resources in the Chapter Additional resources.
We encourage users of the handbook to provide feedback and corrections to the handbook editors via email.
Accompanying software: GRADEpro and the Guideline Development Tool (GDT)
This handbook is intended to accompany the GRADE profiler (GRADEpro) – software to facilitate development of evidence summaries and health care recommendations using the GRADE approach – integrated in the Guideline Development Tool (GDT) “Das tool”. Please refer to www.guidelinedevelopment.org for more information.
Reproduction and translation
Permission to reproduce or translate the GRADE handbook for grading the quality of evidence and the strength of recommendation should be sought from the editors.
Acknowledgements
We would particularly like to acknowledge the contributions of Roman Jaeschke, Robin Harbour and Elie Akl to earlier versions of the handbook.
Major Contributors
Handbook Editors
Holger Schünemann, McMaster University, Hamilton, Canada
Jan Brożek, McMaster University, Hamilton, Canada
Gordon Guyatt, McMaster University, Hamilton, Canada
Andrew Oxman, Norwegian Knowledge Centre for the Health Services, Oslo, Norway
Chapter Authors and Editors
The following authors have made major contributions to the current version of the handbook: Elie Akl, Reem Mustafa, Nancy Santesso Wojtek Wiercioch, and. Many other members of the GRADE Working Group have also contributed to this handbook by providing feedback and through discussion.
Disclaimer: Section 1 has been updated in the new GRADE Book and is available here: https://book.gradepro.org/guideline/overview-of-the-grade-approach
The GRADE approach is a system for rating the quality of a body of evidence in systematic reviews and other evidence syntheses, such as health technology assessments, and guidelines and grading recommendations in health care. GRADE offers a transparent and structured process for developing and presenting evidence summaries and for carrying out the steps involved in developing recommendations. It can be used to develop clinical practice guidelines (CPG) and other health care recommendations (e.g. in public health, health policy and systems and coverage decisions).
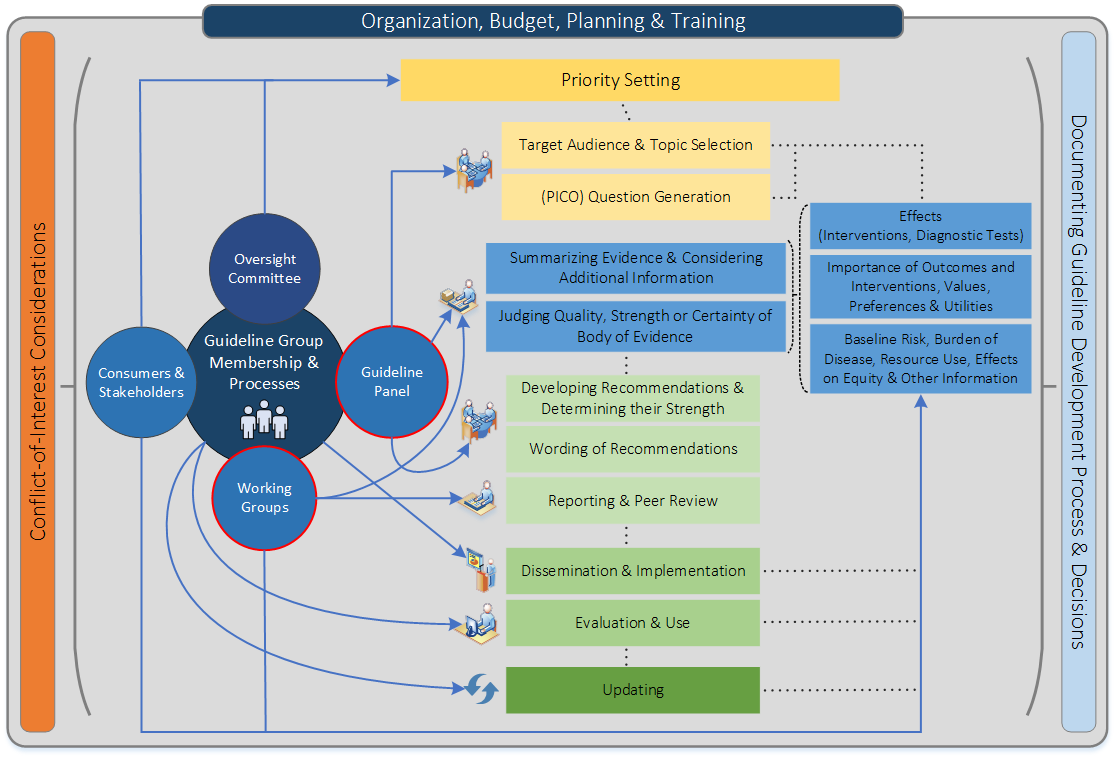
Figure 1 shows the steps and involvement in a guideline development process (Schünemann H et al., CMAJ, 2013).
Steps and processes are interrelated and not necessarily sequential. The guideline panel and supporting groups (e.g. methodologist, health economist, systematic review team, secretariat for administrative support) work collaboratively, informed through consumer and stakeholder involvement. They typically report to an oversight committee or board overseeing the process. For example, while deciding how to involve stakeholders early for priority setting and topic selection, the guideline group must also consider how developing formal relationships with the stakeholders will enable effective dissemination and implementation to support uptake of the guideline. Furthermore, considerations for organization, planning and training encompass the entire guideline development project, and steps such as documenting the methodology used and decisions made, as well as considering conflict-of-interest occur throughout the entire process.
The system is designed for reviews and guidelines that examine alternative management strategies or interventions, which may include no intervention or current best management as well as multiple comparisons. GRADE has considered a wide range of clinical questions, including diagnosis, screening, prevention, and therapy. Guidance specific to applying the GRADE approach to questions about diagnosis is offered in Chapter The GRADE approach for diagnostic tests and strategies
GRADE provides a framework for specifying health care questions, choosing outcomes of interest and rating their importance, evaluating the available evidence, and bringing together the evidence with considerations of values and preferences of patients and society to arrive at recommendations. Furthermore, the system provides clinicians and patients with a guide to using those recommendations in clinical practice and policy makers with a guide to their use in health policy.
Application of the GRADE approach begins by defining the health care question in terms of the population of interest, the alternative management strategies (intervention and comparator), and all patient-important outcomes. As a specific step for guideline developers, the outcomes are rated according to their importance, as either critical or important but not critical. A systematic search is preformed to identify all relevant studies and data from the individual included studies is used to generate an estimate of the effect for each patient-important outcome as well as a measure of the uncertainty associated with that estimate (typically a confidence interval). The quality of evidence for each outcome across all the studies (i.e. the body of evidence for an outcome) is rated according to the factors outlined in the GRADE approach, including five factors that may lead to rating down the quality of evidence and three factors that may lead to rating up. Authors of systematic reviews complete the process up to this step, while guideline developers continue with the subsequent steps. Health care related related tests and strategies are considered interventions (or comparators) as utilizing a test inevitably has consequences that can be considered outcomes (see Chapter The GRADE approach for diagnostic tests and strategies).
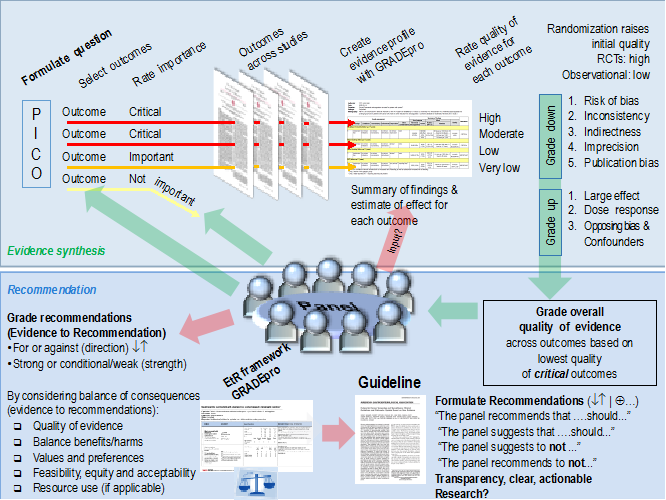
Next, guideline developers review all the information from the systematic search and, if needed, reassess and make a final decision about which outcomes are critical and which are important given the recommendations that they aim to formulate. The overall quality of evidence across all outcomes is assigned based on this assessment. Guideline developers then formulate the recommendation(s) and consider the direction (for or against) and grade the strength (strong or weak) of the recommendation(s) based on the criteria outlined in the GRADE approach. Figure 2 provides a schematic view of the GRADE approach.
Figure 2: A schematic view of the GRADE approach for synthesizing evidence and developing recommendations. The upper half describe steps in the process common to systematic reviews and making health care recommendations and the lower half describe steps that are specific to making recommendations (based on GRADE meeting, Edingburgh 2009).
For authors of systematic reviews:
Systematic reviews should provide a comprehensive summary of the evidence but they should typically not include health care recommendations. Therefore, use of the GRADE approach by systematic review authors terminates after rating the quality of evidence for outcomes and clearly presenting the results in an evidence table, i.e. an GRADE Evidence Profile or a Summary of Findings table. Those developing health care recommendations, e.g. a guideline panel, will have to complete the subsequent steps.
The following chapters will provide detailed guidance about the factors that influence the quality of evidence and strength of recommendations as well as instructions and examples for each step in the application of the GRADE approach. A detailed description of the GRADE approach for authors of systematic reviews and those making recommendations in health care is also available in a series of articles published in the Journal of Clinical Epidemiology. An additional overview of the GRADE approach as well as quality of evidence and strength of recommendations in guidelines is available in a previously published six-part series in the British Medical Journal. Briefer overviews have appeared in other journals, primarily with examples for relevant specialties. The articles are listed in Chapter 10. This handbook, however, as a resource that exists primarily in electronic format, will include GRADE’s innovations and be kept up to date as journal publications become outdated.
Clinical practice guidelines offer recommendations for the management of typical patients. These management decisions involve balancing the desirable and undesirable consequences of a given course of action. In order to help clinicians make evidence-based medical decisions, guideline developers often grade the strength of their recommendations and rate the quality of the evidence informing those recommendations.
Prior grading systems had many disadvantages including the lack of separation between the quality of evidence and strength of recommendation, the lack of transparency about judgments, and the lack of explicit acknowledgment of values and preferences underlying the recommendations. In addition, the existence of many, often scientifically outdated, grading systems has created confusion among guideline developers and end users.
The GRADE approach was developed to overcome these shortcomings of previous grading systems. Advantages of GRADE over other grading systems include:
Note:
Although the GRADE approach makes judgments about quality of evidence, that is confidence in the effect estimates, and strength of recommendations in a systematic and transparent manner, it does not eliminate the need for judgments. Thus, applying the GRADE approach does not minimize the importance of judgment or as suggesting that quality can always be objectively determined.
Although evidence suggests that these judgments, after appropriate methodological training, lead to reliable assessment of the quality of evidence (Mustafa R et al., Journal of Clinical Epidemiology, 2013). There will be cases in which those making judgments will have legitimate disagreement about the interpretation of evidence. GRADE provides a framework guiding through the critical components of the assessment in a structured way. By allowing to make the judgments explicit rather than implicit it ensures transparency and a clear basis for discussion.
A number of criteria should be used when moving from evidence to recommendations (see Chapter on Going from evidence to recommendations). During that process, separate judgements are required for each of these criteria. In particular, separating judgements about the confidence in estimates or quality of evidence from judgements about the strength of recommendations is important as high confidence in effect estimates does not necessarily imply strong recommendations, and strong recommendations can result from low or even very low confidence in effect estimates (insert link to paradigmatic situations for when strong recommendations are justified in the context of low or very low confidence in effect estimates). Grading systems that fail to separate these judgements create confusion, while it is the defining feature of GRADE.
The GRADE approach stresses the necessity to consider the balance between desirable and undesirable consequences and acknowledge other factors, for example the values and preferences underlying the recommendations. As patients with varying values and preferences for outcomes and interventions will make different choices, guideline panels facing important variability in patient values and preferences are likely to offer a weak recommendation despite high quality evidence. Considering importance of outcomes and interventions, values, preferences and utilities includes integrating in the process of developing a recommendation, how those affected by its recommendations assess the possible consequences. These include patient and carer knowledge, attitudes, expectations, moral and ethical values, and beliefs; patient goals for life and health; prior experience with the intervention and the condition; symptom experience (for example breathlessness, pain, dyspnoea, weight loss); preferences for and importance of desirable and undesirable health outcomes; perceived impact of the condition or interventions on quality of life, well-being or satisfaction and interactions between the work of implementing the intervention, the intervention itself, and other contexts the patient may be experiencing; preferences for alternative courses of action; and preferences relating to communication content and styles, information and involvement in decision-making and care. This can be related to what in the economic literature is considered utilities. An intervention itself can be considered a consequence of a recommendation (e.g. the burden of taking a medication or undergoing surgery) and a level of importance or value is associated with that. Both the direction and the strength of a recommendation may be modified after taking into account the implications for resource utilization, equity, acceptability and feasibility of alternative management strategies.
Therefore, unlike many other grading systems, the GRADE approach emphasizes that weak also known as conditional recommendations in the face of high confidence in effect estimates of an intervention are common because of these factors other than the quality of evidence influencing the strength of a recommendation. For the same reason it allows for strong recommendations on the basis of low or very confidence in effect estimates.
Example 1: Weak recommendation based on high quality evidence
Several RCTs compared the use of combination chemotherapy and radiotherapy versus radiotherapy alone in unresectable, locally advanced non-small cell lung cancer (Stage IIIA). The overall quality of evidence for the body of evidence was rated high. Compared with radiotherapy alone, the combination of chemotherapy and radiotherapy reduces the risk of death corresponding to a mean gain in life expectancy of a few months, but increases harm and burden related to chemotherapy. Thus, considering the values and preferences patients would place on the small survival benefit in view of the harms and burdens, guideline panels may offer a weak recommendation despite the high quality of the available evidence (Schünemann et al. AJRCCM 2006).
Example 2: Weak recommendation based on high quality evidence
Patients who experience a first deep venous thrombosis with no obvious provoking factor must, after the first months of anticoagulation, decide whether to continue taking the anticoagulant warfarin long term. High quality randomized controlled trials show that continuing warfarin will decrease the risk of recurrent thrombosis but at the cost of increased risk of bleeding and inconvenience. Because patients with varying values and preferences will make different choices, guideline panels addressing whether patients should continue or terminate warfarin should, despite the high quality evidence, offer a weak recommendation.
Example 3: Strong recommendation based on low or very low quality evidence
The principle of administering appropriate antibiotics rapidly in the setting of severe infection or sepsis has not been tested against its alternative of no rush of delivering antibiotics in randomized controlled trials. Yet, guideline panels would be very likely to make a strong recommendation for the rapid use of antibiotics in this setting on the basis of available observational studies rated as low quality evidence because the benefits of antibiotic therapy clearly outweigh the downsides in most patients independent of the quality assessment (Schünemann et al. AJRCCM 2006)..
Those applying GRADE to questions about diagnostic tests, public health or health systems will face some special challenges. This handbook will address these challenges and undergo revisions when new developments prompt the GRADE working group to agree on changes to the approach. Moreover, there will be methodological advances and refinements in the future not only of innovations but also of the established concepts.
GRADE recommends against making modifications to the approach because the elements of the GRADE process are interlinked, because modifications may confuse some users of evidence summaries and guidelines, and because such changes compromise the goal of a single system with which clinicians, policy makers, and patients can become familiar. However, the literature on different approaches to applying GRADE is growing and are useful to determine when pragmatism is appropriate.
Disclaimer: Section 2 has been updated in the new GRADE Book and is available here: https://book.gradepro.org/guideline/questions-about-interventions-diagnostic-test-prognosis-and-exposures
A guideline panel should define the scope of the guideline and the planned recommendations. Each recommendation should answer a focused and sensible health care question that leads to an action. Similarly, authors of systematic reviews should formulate focused health care question(s) that the review will answer. A systematic review may answer one or more health care questions, depending on the scope of the review.
The PICO framework presents a well accepted methodology for framing health care questions. It mandates carefully specifying four components:
A number of derivatives of this approach exist, for example adding a T for time or S for study design. These modifications are neither helpful nor necessary. The issue of time (e.g. duration of treatment, when an outcome should be assessed, etc) is covered in the elements by specifying the intervention(s) and outcome(s) appropriately (e.g. mortality at one year). In addition, the studies, and therefore the study design, that inform an answer are often not known when the question is asked. That is, observational studies may inform a question when randomized trials are no available or not associated with high confidence in the estimates. Thus, it is usually not sensible to define a study design beforehand. A guideline question often involves another specification: the setting in which the guideline will be implemented. For instance, guidelines intended for resource-rich environments will often be inapplicable to resource-poor environments. Even the setting, however, can be defined as part of the definition of the population (e.g. women in low income countries or man with myocardial infarction in a primary or rural health care setting).
Errors that are frequently made in formulating the health care question include failure to include all patient-important outcomes (e.g. adverse effects or toxicity), as well as failure to fully consider all relevant alternatives (this may be particularly problematic when guidelines target a global audience).
The most challenging decision in framing the question is how broadly the patients and intervention should be defined (see Example 1). For the patients and interventions defined, the underlying biology should suggest that across the range of patients and interventions it is plausible that the magnitude of effect on the key outcomes is more or less the same. If that is not the case the review or guideline will generate misleading estimates for at least some subpopulations of patients and interventions. For instance, based on the information presented in Example 1, if antiplatelet agents differ in effectiveness in those with peripheral vascular disease vs. those with myocardial infarction, a single estimate across the range of patients and interventions will not well serve the decision-making needs of patients and clinicians. These subpopulations should, therefore, be defined separately.
Often, systematic reviews deal with the question of what breadth of population or intervention to choose by starting with a broad question but including a priori specification of subgroup effects that may explain any heterogeneity they find. The a priori hypotheses may relate to differences in patients, interventions, the choice of comparator, the outcome(s), or factors related to bias (e.g. high risk of bias studies yield different effects than low risk of bias studies).
Example 1: Deciding how to broadly to define the patients and intervention
Addressing the effects of antiplatelet agents on vascular disease, one might include only patients with transient ischemic attacks, those with ischemic attacks and strokes, or those with any vascular disease (cerebro-, cardio-, or peripheral vascular disease). The intervention might be a relatively narrow range of doses of aspirin, all doses of aspirin, or all antiplatelet agents.
Because the relative risk associated with an intervention vs. a specific comparator is usually similar across a wide variety of baseline risks, it is usually appropriate for systematic reviews to generate single pooled estimates (i.e. meta-analysis) of relative effects across a wide range of patient subgroups. Recommendations, however, may differ across subgroups of patients at different baseline risk of an outcome, despite there being a single relative risk that applies to all of them. For instance, the case for warfarin therapy, associated with both inconvenience and a higher risk of serious bleeding, is much stronger in atrial fibrillation patients at substantial vs. minimal risk of stroke. Thus, guideline panels must often define separate questions (and produce separate evidence summaries) for high- and low-risk patients, and patients in whom quality of evidence differs.
Another important challenge arises when there are multiple comparators to an intervention. Clarity in choice of the comparator makes for interpretable guidelines, and lack of clarity can cause confusion. Sometimes, the comparator is obvious, but when it is not guideline panels should specify the comparator explicitly. In particular, when multiple agents are involved, they should specify whether the recommendation is suggesting that all agents are equally recommended or that some agents are recommended over others (see Example 1).
Example 1: Clarity with multiple comparators
When making recommendations for use of anticoagulants in patients with non-ST elevation acute coronary syndromes receiving conservative (non-invasive) management, fondaparinux, heparin, and enoxaparin may be the agents being considered. Moreover, the estimate of effect for each agent may come from evidence of varying quality (e.g. high quality evidence for heparin, low quality of evidence for fondaparinux). Therefore, it must be made clear whether the recommendations formulated by the guideline panel will be for use of these agents vs. not using any anticoagulants, or also whether they will indicate a preference for one agent over the others or a gradient of preference.
GRADE has begun to tackle the question of determining the confidence in estimates for prognosis. They are often important for guideline development. For example, addressing interventions that may influence the outcome of influenza or multiple sclerosis will require establishing the natural history of the conditions. This will involve specifying the population (influenza or new-onset multiple sclerosis) and the outcome (mortality or relapse rate and progression). Such questions of prognosis may be refined to include multiple predictors, such as age, gender, or severity. The answers to these questions will be an important background for formulating recommendations and interpreting the evidence about the effects of treatments. In particular, guideline developers need to decide whether the prognosis of patients in the community is similar to those studied in the trials and whether there are important prognostic subgroups that they should consider in making recommendations. Judgments if the evidence is direct enough in terms of baseline risk affect the rating about indirectness of evidence.
Defining a health care question includes specifying all outcomes of interest. Those developing recommendations whether or not to use a given intervention (therapeutic or diagnostic) have to consider all relevant outcomes simultaneously. The Guideline Development Tool allows the selection of two different formats for questions about management:
As well as one format for questions about diagnosis:
Example Questions
1. Should manual toothbrushes vs. powered toothbrushes be used for dental health?
2. Should topical nasal steroids be used in children with persistent allergic rhinitis?
3. Should oseltamivir versus no antiviral treatment be used to treat influenza?
4. Should troponin I followed by appropriate management strategies or troponin T followed by appropriate management strategies be used to manage acute myocardial infarction?
Disclaimer: Section 3 has been updated in the new GRADE Book and is available here: https://book.gradepro.org/guideline/outcomes
Training modules and courses: http://cebgrade.mcmaster.ca/QuestionsAndOutcomes/index.html
Given that recommendations cannot be made on the basis of information about single outcomes and decision-making always involves a balance between health benefits and harms. Authors of systematic reviews will make their reviews more useful by looking at a comprehensive range of outcomes that allow decision making in health care. Many, if not most, systematic reviews fail to address some key outcomes, particularly harms, associated with an intervention.
On the contrary, to make sensible recommendations guideline panels must consider all outcomes that are important or critical to patients for decision making. In addition, they may require consideration of outcomes that are important to others, including the use of resources paid for by third parties, equity considerations, impacts on those who care for patients, and public health impacts (e.g. the spread of infections or antibiotic resistance).
Guideline developers must base the choice of outcomes on what is important, not on what outcomes are measured and for which evidence is available. If evidence is lacking for an important outcome, this should be acknowledged, rather than ignoring the outcome. Because most systematic reviews do not summarize the evidence for all important outcomes, guideline panels must often either use multiple systematic reviews from different sources, conduct their own systematic reviews or update existing reviews.
Guideline developers must, and authors of systematic reviews are strongly encouraged to specify all potential patient-important outcomes as the first step in their endeavour. Guideline developers will also make a preliminary classification of the importance of the outcomes. GRADE specifies three categories of outcomes according to their importance for decision-making:
Critical and important outcomes will bear on guideline recommendations, the third will in most situations not. Ranking outcomes by their relative importance can help to focus attention on those outcomes that are considered most important, and help to resolve or clarify disagreements. Table 3.1 provides an overview of the steps for considering the relative importance of outcomes.
Guideline developers should first consider whether particular health benefits and harms of a therapy are important to the decision regarding the optimal management strategy, or whether they are of limited importance. If the guideline panel thinks that a particular outcome is important, then it should consider whether the outcome is critical to the decision, or only important, but not critical.
To facilitate ranking of outcomes according to their importance guideline developers may choose to rate outcomes numerically on a 1 to 9 scale (7 to 9 – critical; 4 to 6 – important; 1 to 3 – of limited importance) to distinguish between importance categories.
Practically, to generate a list of relevant outcomes, one can use the following type of scales.
|
rating scale: |
||||||||
|
1 |
2 |
3 |
4 |
5 |
6 |
7 |
8 |
9 |
|
of least importance |
of most importance |
|||||||
|
of limited importance for making a decision (not included in evidence profile) |
important, but not critical for making a decision (included in evidence profile) |
Critical for making a decision (included in evidence profile) |
||||||
The first step of a classification of importance of outcomes should occur during protocol of a systematic review or when the panel agrees on the health care questions that should be addressed in a guideline. Thus, it should be done before a protocol is developed. When evidence becomes available a reassessment of importance may be necessary to ensure that important outcomes identified by reviews of the evidence that were not initially considered are included and to reconsider the relative importance of outcomes in light of the available evidence which will be influenced by the relative importance of the outcome. It is possible that there is no association between the outcome and the intervention of interest which supports to not consider that outcome further.
Guideline panels should be aware of the possibility that in some instances the importance of an outcome (e.g. a serious adverse effect) may only become known after the protocol is written, evidence is reviewed or the analyses were carried out, and should take appropriate actions to include these in the evidence tables.
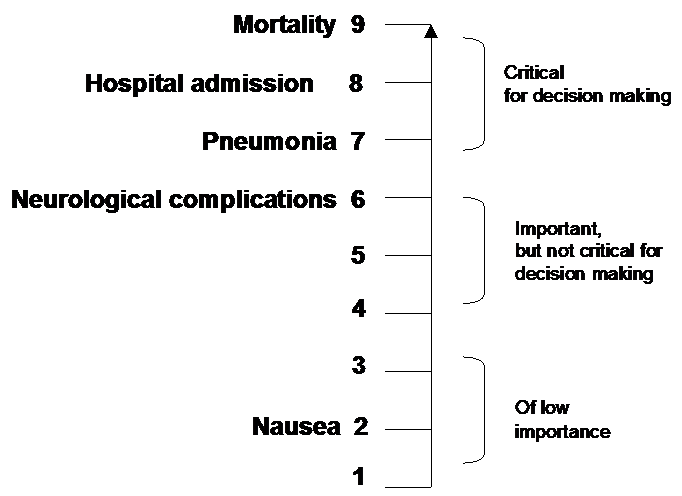
Example 1: Hierarchy of outcomes according to their importance to assess the effect of oseltamivir in patients with H5N1 influenza. Mortality in patients affected with H5N1 is as high as 50%. Patient are usually affected by severe respiratory compromise and require ventilatory support. Complications of a potentially useful medication, oseltamivir, are suspected to be of temporary neurological nature, other adverse effects such as nausea also occur during treatment.
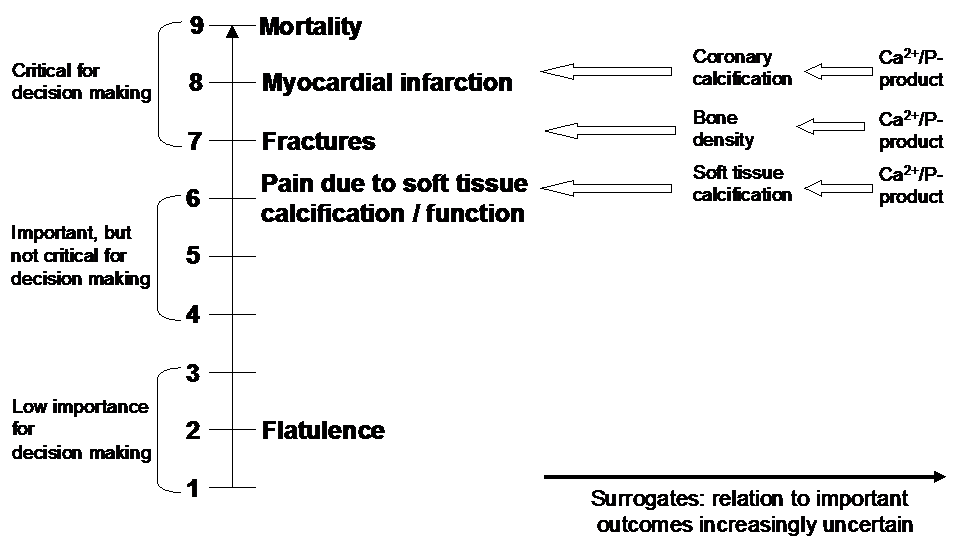
Example 2. Hierarchy of outcomes according to their importance to assess the effect of phosphate-lowering drugs in patients with renal failure and hyperphosphatemia
Example 3: Reassessment of the relative importance of outcomes
Consider, for instance, a screening intervention, such as screening for aortic abdominal aneurysm. Initially, a guideline panel is likely to consider the intervention’s impact on all-cause mortality as critical. Let us say, however, that the evidence summary establishes an important reduction in cause-specific mortality from abdominal aortic aneurysm but fails to definitively establish a reduction in all-cause mortality. The reduction in cause-specific mortality may be judged sufficiently compelling that, even in the absence of a demonstrated reduction in all-cause mortality (which may be undetected because of random error from other causes of death), the screening intervention is clearly worthwhile. All-cause mortality then becomes less relevant and ceases to be a critical outcome.
The relative importance of outcomes should be considered when determining the overall quality of evidence, which may depend on which outcomes are ranked as critical or important (see Chapter Quality of evidence), and judging the balance between the health benefits and harms of an intervention when formulating the recommendations (see Chapter Going from evidence to recommendations)
Only outcomes considered critical (rated 7-9) are the primary factors influencing a recommendation and will be used to determine the overall quality of evidence supporting a recommendation.
|
Table 3.1: Steps for considering the relative importance of outcomes |
||||
|
Step |
What |
Why |
How |
Evidence |
|
1 |
Preliminary classification of outcomes as critical, important but not critical, or low importance, before reviewing the evidence |
To focus attention on those outcomes that are considered most important when searching for and summarizing the evidence and to resolve or clarify disagreements. |
Conducting a systematic review of the relevant literature. By asking panel members and possibly patients or members of the public to identify important outcomes, judging the relative importance of the outcomes and discussing disagreements. |
These judgments are ideally informed by a systematic review of the literature focusing on what the target population considers as critical or important outcomes for decision making. Literature about values, preferences or utilities is often used in these reviews, that should be systematic in nature. Alternatively the collective experience of the panel members, patients, and members of the public can be used using transparent methods for documenting and considering them (see Santesso N et al, IJOBGYN 2012). Prior knowledge of the research evidence or, ideally, a systematic review of that evidence is likely to be helpful. |
|
2 |
Reassessment of the relative importance of outcomes after reviewing the evidence |
To ensure that important outcomes identified by reviews of the evidence that were not initially considered are included and to reconsider the relative importance of outcomes in light of the available evidence |
By asking the panel members (and, if relevant, patients and members of the public) to reconsider the relative importance of the outcomes included in the first step and any additional outcomes identified by reviews of the evidence |
Experience of the panel members and other informants and systematic reviews of the effects of the intervention |
|
3 |
Judging the balance between the desirable and undesirable health outcomes of an intervention |
To support making a recommendation and to determine the strength of the recommendation |
By asking the panel members to balance the desirable and undesirable health outcomes using an evidence to recommendation framework that includes a summary of findings table or evidence profile and, if relevant, based on a decision analysis |
Experience of the panel members and other informants, systematic reviews of the effects of the intervention, evidence of the value that the target population attach to key outcomes (if relevant and available) and decision analysis or economic analyses (if relevant and available) |
The importance of outcomes is likely to vary within and across cultures or when considered from the perspective of the target population (e.g. patients or the public), clinicians or policy-makers. Cultural diversity will often influence the relative importance of outcomes, particularly when developing recommendations for an international audience.
Guideline panels must decide what perspective they are taking. Although different panels may elect to take different perspectives (e.g. that of individual patients or a health systems perspective), the relative importance given to health outcomes should reflect the perspective of those who are affected. When the target audiences for a guideline are clinicians and the patients they treat, the perspective would generally be that of the patient. (see Chapter Going from evidence to recommendations that addresses the issue of perspective from the point of view of resource use)
Guideline developers will ideally review evidence, or conduct a systematic review of the evidence, relating to patients’ values and preferences about the intervention in question in order to inform the rating of the importance of outcomes. Reviewing the evidence may provide the panel with insight about the variability in patients’ values, the patient experience of burden or side effects, and the weighing of desirable versus undesirable outcomes.
In the absence of such evidence, panel members should use their prior experiences with the target population to assume the relevant values and preferences.
Not infrequently, outcomes of most importance to patients remain unexplored. When important outcomes are relatively infrequent, or occur over long periods of time, investigators often choose to measure substitutes, or surrogates, for those outcomes.
Guideline developers should consider surrogate outcomes only when evidence about population-important outcomes is lacking. When this is the case, they should specify the population-important outcomes and, if necessary, the surrogates they are using to substitute for those important outcomes. Guideline developers should not list the surrogates themselves as their measures of outcome. The necessity to substitute the surrogate may ultimately lead to rating down the quality of the evidence because of the indirectness (see Chapter Quality of evidence).
Outcomes selected by the guideline panel should be included in an evidence profile whether or not information about them is available (see Chapter Summarizing the evidence), that is an empty row in an evidence profile can be informative in that it identifies research gaps.
A guideline panel should base its recommendation on the best available body of evidence related to the health care question. A guideline panel can use already existing high quality systematic reviews or conduct its own systematic review depending on the specific circumstances such as availability of high quality systematic reviews and resources, but GRADE recommends that systematic reviews should form the basis for making health care recommendations. One should seek evidence relating to all patient-important outcomes and for the values patients place on these outcomes as well as related management options.
The endpoint for systematic reviews and for HTA restricted to evidence reports is a summary of the evidence, the quality rating for each outcome and the estimate of effect. For guideline developers and HTA that provide advice to policymakers, a summary of the evidence represents a key milestone on the path to a recommendation. The evidence collected from systematic reviews is used to produce GRADE evidence profile and summary of findings table.
An evidence table is a key tool in the presentation of evidence and the corresponding results. Evidence tables are a method for presenting the quality of the available evidence, the judgments that bear on the quality rating, and the effects of alternative management strategies on the outcomes of interest.
Clinicians, patients, the public, guideline developers, and policy-makers require succinct and transparent evidence summaries to support their decisions. While an unambiguous health care question is key to evidence summaries, the requirements for specific users may differ in content and detail. Therefore, the format of each table may be different depending on user needs.
Two approaches (with iterations) for evidence tables are available, which serve different purposes and are intended for different audiences:
The Guideline Development Tool facilitates the production of both Evidence Profiles and SoF tables. After completing the information to populate the tables, the information will be stored and can be updated accordingly. Different formats for each aproach, chosen according to what the target audience may prefer, are available.
Outcomes considered important (rated 4-6) or critical (rated 7-9) for decision-making should be included in the evidence profile and SoF table.
See online tutorials at: cebgrade.mcmaster.ca
The GRADE evidence profile contains detailed information about the quality of evidence assessment and the summary of findings for each of the included outcomes. It is intended for review authors, those preparing SoF tables and anyone who questions a quality assessment. It helps those preparing SoF tables to ensure that the judgments they make are systematic and transparent and it allows others to inspect those judgments. Guideline panels should use evidence profiles to ensure that they agree about the judgments underlying the quality assessments.
A GRADE evidence profile allows presentation of key information about all relevant outcomes for a given health care question. It presents information about the body of evidence (e.g. number of studies), the judgments about the underlying quality of evidence, key statistical results, and the quality of evidence rating for each outcome.
A GRADE evidence profile is particularly useful for presentation of evidence supporting a recommendation in clinical practice guidelines but also as summary of evidence for other purposes where users need or want to understand the judgments about the quality of evidence in more detail.
The standard format for the evidence profile includes:
Example 1: GRADE Evidence Profile
[INSERT IMAGE]
Summary of Findings tables provide a summary of findings for each of the included outcomes and the quality of evidence rating for each outcome in a quick and accessible format, without details of the judgements about the quality of evidence. They are intended for a broader audience, including end users of systematic reviews and guidelines. They provide a concise summary of the key information that is needed by someone making a decision and, in the context of a guideline, provide a summary of the key information underlying a recommendation
The format of SoF tables produced using the Guideline Development Tool has been refined over the past several years through wide consultation, user testing, and evaluation. It is designed to support the optimal presentation of the key findings of systematic reviews. The SoF table format has been developed with the aim of ensuring consistency and ease of use across reviews, inclusion of the most important information needed by decision makers, and optimal presentation of this information. However, there may be good reasons for modifying the format of a SoF table for some reviews.
The standard format for the SoF table includes:
Systematic reviews that address more than one main comparison (e.g. examining the effects of a number of interventions) will require separate SoF tables for each comparison. Moreover, for each comparison of alternative management strategies, all outcomes should be presented together in one evidence profile or SoF table. It is likely that all studies relevant to a health care question will not provide evidence regarding every outcome. Indeed, there may be no overlap between studies providing evidence for one outcome and those providing evidence for another. Because most existing systematic reviews do not adequately address all relevant outcomes, the GRADE process may require relying on more than one systematic review.
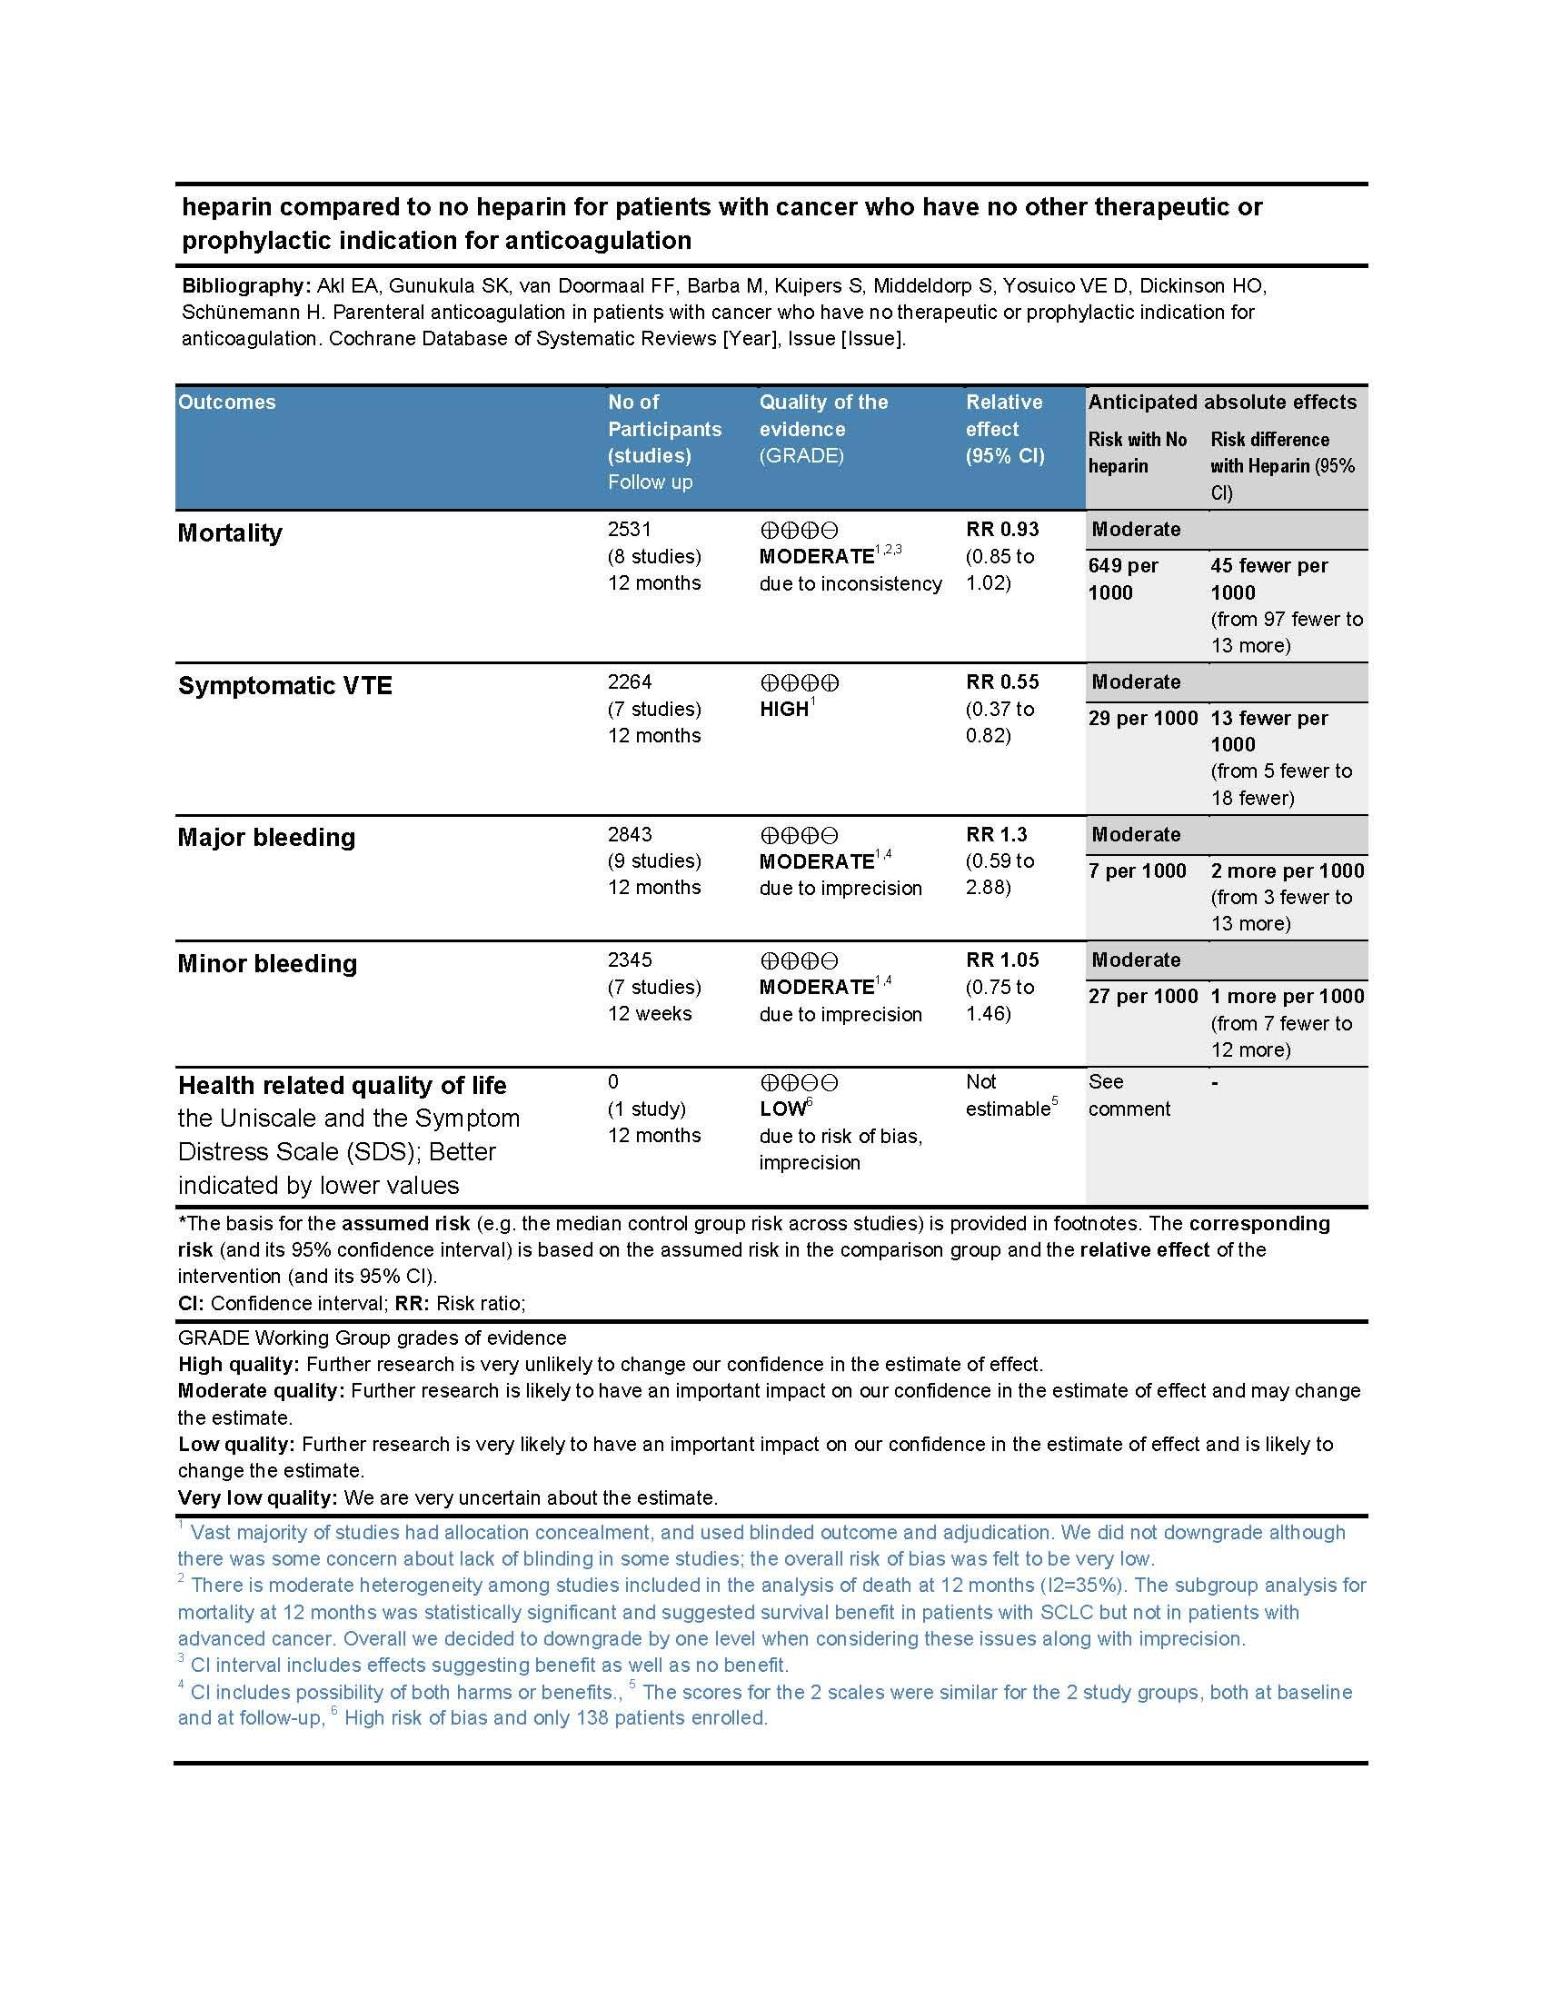
Example 2: GRADE Summary of Findings Table
[INSERT IMAGE]
Disclaimer: Section 5 has been updated in the new GRADE Book and is available here: https://book.gradepro.org/guideline/principles-for-assessing-the-certainty-of-interventions
GRADE provides a specific definition of the quality of evidence that is different in the context of making recommendations and in the context of summarizing the findings of a systematic review.
As GRADE suggests somewhat different approaches for rating the quality of evidence for systematic reviews and for guidelines, the handbook highlights guidance that is specific to each group. HTA practitioners, depending on their mandate, can decide which approach is more suitable for their goals.
For guideline panels:
The quality of evidence reflects the extent to which our confidence in an estimate of the effect is adequate to support a particular recommendation.
Guideline panels must make judgments about the quality of evidence relative to the specific context for which they are using the evidence.
The GRADE approach involves separate grading of quality of evidence for each patient-important outcome followed by determining an overall quality of evidence across outcomes.
For authors of systematic reviews:
The quality of evidence reflects the extent to which we are confident that an estimate of the effect is correct.
Because systematic reviews do not, or at least should not, make recommendations, they require a different definition. Authors of systematic reviews grade quality of a body of evidence separately for each patient-important outcome.
The quality of evidence is rated for each outcome across studies (i.e. for a body of evidence). This does not mean rating each study as a single unit. Rather, GRADE is “outcome centric”; rating is done for each outcome, and quality may differ - indeed, is likely to differ - from one outcome to another within a single study and across a body of evidence.
Example 1: Quality of evidence may differ from one outcome to another within a single study
In a series of unblinded RCTs measuring both the occurrence of stroke and all-cause mortality, it is possible that stroke - much more vulnerable to biased judgments - will be rated down for risk of bias, whereas all-cause mortality will not. Similarly, a series of studies in which very few patients are lost to follow-up for the outcome of death, and very many for the outcome of quality of life, is likely to result in judgments of lower quality for the latter outcome. Problems with indirectness may lead to rating down quality for one outcome and not another within a study or studies if, for example, fracture rates are measured using a surrogate (e.g. bone mineral density) but side effects are measured directly.
Although the quality of evidence represents a continuum, the GRADE approach results in an assessment of the quality of a body of evidence in one of four grades:
|
Table 5.1: Quality of Evidence Grades |
|
|
Grade |
Definition |
|
High |
We are very confident that the true effect lies close to that of the estimate of the effect. |
|
Moderate |
We are moderately confident in the effect estimate: The true effect is likely to be close to the estimate of the effect, but there is a possibility that it is substantially different |
|
Low |
Our confidence in the effect estimate is limited: The true effect may be substantially different from the estimate of the effect. |
|
Very Low |
We have very little confidence in the effect estimate: The true effect is likely to be substantially different from the estimate of effect |
Quality of evidence is a continuum; any discrete categorisation involves some degree of arbitrariness. Nevertheless, advantages of simplicity, transparency, and vividness outweigh these limitations.
The GRADE approach to rating the quality of evidence begins with the study design (trials or observational studies) and then addresses five reasons to possibly rate down the quality of evidence and three to possibly rate up the quality. The subsequent sections of the handbook will address each of the factors in detail.
|
Table 5.2: Factors that can reduce the quality of the evidence |
|
|
Factor |
Consequence |
|
Limitations in study design or execution (risk of bias) |
↓ 1 or 2 levels |
|
Inconsistency of results |
↓ 1 or 2 levels |
|
Indirectness of evidence |
↓ 1 or 2 levels |
|
Imprecision |
↓ 1 or 2 levels |
|
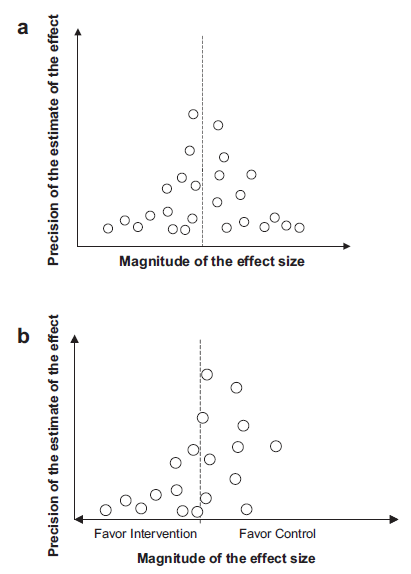
Publication bias |
↓ 1 or 2 levels |
|
Table 5.3: Factors that can increase the quality of the evidence |
|
|
Factor |
Consequence |
|
Large magnitude of effect |
↑ 1 or 2 levels |
|
All plausible confounding would reduce the demonstrated effect or increase the effect if no effect was observed |
↑ 1 level |
|
Dose-response gradient |
↑ 1 level |
While factors influencing the quality of evidence are additive – such that the reduction or increase in each individual factor is added together with the other factors to reduce or increase the quality of evidence for an outcome – grading the quality of evidence involves judgements which are not exclusive. Therefore, GRADE is not a quantitative system for grading the quality of evidence. Each factor for downgrading or upgrading reflects not discrete categories but a continuum within each category and among the categories. When the body of evidence is intermediate with respect to a particular factor, the decision about whether a study falls above or below the threshold for up- or downgrading the quality (by one or more factors) depends on judgment.
For example, if there was some uncertainty about the three factors: study limitations, inconsistency, and imprecision, but not serious enough to downgrade each of them, one could reasonably make the case for downgrading, or for not doing so. A reviewer might in each category give the studies the benefit of the doubt and would interpret the evidence as high quality. Another reviewer, deciding to rate down the evidence by one level, would judge the evidence as moderate quality. Reviewers should grade the quality of the evidence by considering both the individual factors in the context of other judgments they made about the quality of evidence for the same outcome.
In such a case, you should pick one or two categories of limitations which you would offer as reasons for downgrading and explain your choice in the footnote. You should also provide a footnote next to the other factor, you decided not to downgrade, explaining that there was some uncertainty, but you already downgraded for the other factor and further lowering the quality of evidence for this outcome would seem inappropriate. GRADE strongly encourages review and guideline authors to be explicit and transparent when they find themselves in these situations by acknowledging borderline decisions.
Despite the limitations of breaking continua into categories, treating each criterion for rating quality up or down as discrete categories enhances transparency. Indeed, the great merit of GRADE is not that it ensures reproducible judgments but that it requires explicit judgment that is made transparent to users.
Study design is critical to judgments about the quality of evidence.
For recommendations regarding management strategies – as opposed to establishing prognosis or the accuracy of diagnostic tests – randomized trials provide, in general, far stronger evidence than observational studies, and rigorous observational studies provide stronger evidence than uncontrolled case series.
In the GRADE approach to quality of evidence:
Limitations or special strengths can, however, modify the quality of the evidence of both randomized trials and observational studies.
Note:
Non-randomised experimental trials (quasi-RCT) without important limitations also provide high quality evidence, but will automatically be downgraded for limitations in design (risk of bias) – such as lack of concealment of allocation and tie with a provider (e.g. chart number).
Case series and case reports are observational studies that investigate only patients exposed to the intervention. Source of control group results is implicit or unclear, thus, they will usually warrant downgrading from low to very low quality evidence.
Expert opinion is not a category of quality of evidence. Expert opinion represents an interpretation of evidence in the context of experts' experiences and knowledge. Experts may have opinion about evidence that may be based on interpretation of studies ranging from uncontrolled case series (e.g. observations in expert’s own practice) to randomized trials and systematic reviews known to the expert. It is important to describe what type of evidence (whether published or unpublished) is being used as the basis for interpretation.
Disclaimer: Section 5.2 has been updated in the new GRADE Book and is available here: https://book.gradepro.org/guideline/risk-of-bias-randomized-trials
The following sections discuss in detail the 5 factors that can result in rating down the quality of evidence for specific outcomes and, thereby, reduce confidence in the estimate of the effect.
Limitations in the study design and execution may bias the estimates of the treatment effect. Our confidence in the estimate of the effect and in the following recommendation decreases if studies suffer from major limitations. The more serious the limitations are, the more likely it is that the quality of evidence will be downgraded. Numerous tools exist to evaluate the risk of bias in randomized trials and observational studies. This handbook describes the key criteria used in the GRADE approach.
Our confidence in an estimate of effect decreases if studies suffer from major limitations that are likely to result in a biased assessment of the intervention effect. For randomized trials, the limitations outlined in Table 5.4are likely to result in biased result.
|
Table 5.4: Study limitations in randomized controlled trials |
|
|
Explanation |
|
|
Lack of allocation concealment |
Those enrolling patients are aware of the group (or period in a crossover trial) to which the next enrolled patient will be allocated (a major problem in “pseudo” or “quasi” randomized trials with allocation by day of week, birth date, chart number, etc.). |
|
Lack of blinding |
Patient, caregivers, those recording outcomes, those adjudicating outcomes, or data analysts are aware of the arm to which patients are allocated (or the medication currently being received in a crossover trial). |
|
Incomplete accounting of patients and outcome events |
Loss to follow-up and failure to adhere to the intention-to-treat principle in superiority trials; or in noninferiority trials, loss to follow-up, and failure to conduct both analyses considering only those who adhered to treatment, and all patients for whom outcome data are available. The significance of particular rates of loss to follow-up, however, varies widely and is dependent on the relation between loss to follow-up and number of events. The higher the proportion lost to follow-up in relation to intervention and control group event rates, and differences between intervention and control groups, the greater the threat of bias. |
|
Selective outcome reporting |
Incomplete or absent reporting of some outcomes and not others on the basis of the results. |
|
Other limitations |
|
Systematic reviews of tools to assess the methodological quality of non-randomized studies have identified over 200 checklists and instruments. We summarize in Table 5.5 the key criteria for observational studies that reflect the contents of these checklists.
|
Table 5.5: Study limitations in observational studies |
|
|
Explanation |
|
|
Failure to develop and apply appropriate eligibility criteria (inclusion of control population) |
|
|
Flawed measurement of both exposure and outcome |
|
|
Failure to adequately control confounding |
|
|
Incomplete or inadequately short follow-up |
Especially within prospective cohort studies, both groups should be followed for the same amount of time. |
Depending on the context and study type, there can be additional limitations than those listed above. Guideline panels and authors of systematic reviews should consider all possible limitations.
Guideline panels or authors of systematic reviews should consider the extent to which study limitations may bias the results (see Examples 1 to 7). If the limitations are serious they may downgrade the quality rating by one or even two levels. Moving from risk of bias criteria for each individual study to a judgment about rating down for quality of evidence for risk of bias across a group of studies addressing a particular outcome presents challenges. We suggest the following principles:
For authors of systematic reviews:
Systematic reviewers working within the context of Cochrane Systematic Reviews, can use the following guidance to assess study limitations (risk of bias) in Cochrane Reviews. Chapter 8 of the Cochrane Handbook provides a detailed discussion of study-level assessments of risk of bias in the context of a Cochrane review, and proposes an approach to assessing the risk of bias for an outcome across studies as ‘low risk of bias’, ‘unclear risk of bias’ and ‘high risk of bias’ (Cochrane Handbook Chapter 8, Section 8.7). These assessments should feed directly into the assessment of study limitations. In particular, ‘low risk of bias’ would indicate ‘no limitation’; ‘unclear risk of bias’ would indicate either ‘no limitation’ or ‘serious limitation’; and ‘high risk of bias’ would indicate either ‘serious limitation’ or ‘very serious limitation’ in the GRADE approach. Cochrane systematic review authors must use their judgment to decide between alternative categories, depending on the likely magnitude of the potential biases.
Every study addressing a particular outcome will differ, to some degree, in the risk of bias. Review authors must make an overall judgment on whether the quality of evidence for an outcome warrants downgrading on the basis of study limitations. The assessment of study limitations should apply to the studies contributing to the results in the Summary of Findings table, rather than to all studies that could potentially be included in the analysis.
|
Table 5.6: Guidance to assess study limitations (risk of bias) in Cochrane Reviews and corresponding GRADE assessment of quality of evidence |
||||
|
Risk of bias |
Across studies |
Interpretation |
Considerations |
GRADE assessment of study limitations |
|
Low |
Most information is from studies at low risk of bias. |
Plausible bias unlikely to seriously alter the results. |
No apparent limitations. |
No serious limitations, do not downgrade |
|
Unclear |
Most information is from studies at low or unclear risk of bias. |
Plausible bias that raises some doubt about the results. |
Potential limitations are unlikely to lower confidence in the estimate of effect. |
No serious limitations, do not downgrade |
|
Potential limitations are likely to lower confidence in the estimate of effect. |
Serious limitations, downgrade one level. |
|||
|
High |
The proportion of information from studies at high risk of bias is sufficient to affect the interpretation of results. |
Plausible bias that seriously weakens confidence in the results. |
Crucial limitation for one criterion, or some limitations for multiple criteria, sufficient to lower confidence in the estimate of effect. |
Serious limitations, downgrade one level |
|
Crucial limitation for one or more criteria sufficient to substantially lower confidence in the estimate of effect. |
Very serious limitations, downgrade two levels |
|||
Example 1: Unclear Risk of Bias (Not Downgraded)
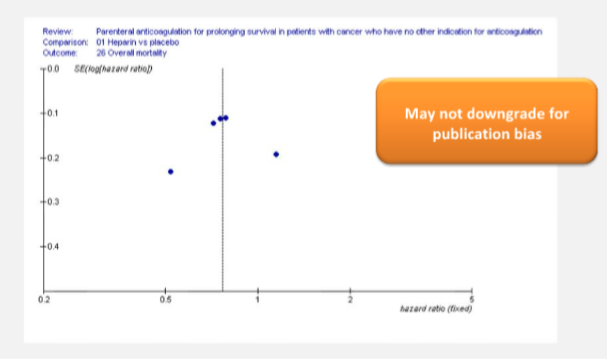
A systematic review investigated whether fewer people with cancer died when given anti-coagulants compared to a placebo. There were 5 RCTs. Three studies had unclear sequence generation as it was not reported by authors and one study (contributing few patients to the meta-analysis) had unclear allocation concealment, and incomplete outcome data. In this case, the overall limitations were not serious and the evidence was not downgraded for risk of bias.
Example 2: Unclear Risk of Bias (Downgraded by One Level)
A systematic review of the effects of testosterone on erection satisfaction in men with low testosterone identified four RCTs. The largest trial’s results were reported only as “not significant” and could not, therefore, contribute to the meta-analysis. Data from the three smaller trials suggested a large treatment effect (1.3 standard deviations, 95% confidence interval 0.2, 2.3). The authors could not obtain the missing data, and could not be confident that the large treatment effect was certain, therefore, they rated down the body of evidence for selective reporting bias in the largest study.
In another scenario, the review authors did obtain the complete data from the larger trial. After including the less impressive results of the large trial, the magnitude of the effect was smaller and no longer statistically significant (0.8 standard deviations, 95% confidence interval 0.05, 1.63). In that case, the evidence would not be downgraded.
Example 3: High Risk of Bias due to lack of blinding (Downgraded by One Level)
RCTs of the effects of Intervention A on acute spinal injury measured both all-cause mortality and, based on a detailed physical examination, motor function. The outcome assessors were not blinded for any outcomes. Blinding of outcome assessors is less important for the assessment of all-cause mortality, but crucial for motor function. The quality of the evidence for the mortality outcome may not be downgraded. However, the quality may be downgraded for the motor function outcome.
Example 4: High Risk of Bias due to lack of allocation concealment (Downgraded by One Level)
A systematic review of 2 RCTs showed that family therapy for children with asthma improved daytime wheeze. However, allocation was clearly not concealed in the two included trials. This limitation might warrant downgrading the quality of evidence by one level.
Example 5: High Risk of Bias (Downgraded by One Level)
A review was conducted to assess the effects of early versus late treatment of influenza with oseltamivir in observational studies. Researchers found 8 observational studies which assessed the risk of mortality. The statistical analysis in all 8 studies did not adjust for potential confounding risk factors such as age, chronic lung conditions, vaccination or immune status. The quality of the evidence was therefore downgraded from low to very low for serious limitations in study design.
Example 6: High Risk of Bias (Downgraded by Two Levels)
Three RCTs of the effects of surgery on patients with lumbar disc prolapse measured symptoms after 1 year or longer. The RCTs suffered from inadequate concealment of allocation, and unblinded assessment of outcome by potentially biased raters (surgeons) using a non-validated rating instrument. The benefit of surgery is uncertain. The quality of the evidence was downgraded by two levels due to these study limitations quality.
Example 7: High Risk of Bias (Downgraded by Two Levels)
The evidence for the effect of sublingual immunotherapy in children with allergic rhinitis on the development of asthma comes from a single randomized trial with no description of randomization, concealment of allocation or type of analysis, there was no blinding and 21% of children were lost to follow-up. These very serious limitations would warrant downgrading the quality of evidence by two levels, from high to low.
Disclaimer: Section 5.2 has been updated in the new GRADE Book and is available here: https://book.gradepro.org/guideline/inconsistency
Inconsistency refers to an unexplained heterogeneity of results.
True differences in the underlying treatment effect may be likely when there are widely differing estimates of the treatment effect (i.e. heterogeneity or variability in results) across studies. Investigators should explore explanations for heterogeneity, and if they cannot identify a plausible explanation, the quality of evidence should be downgraded. Whether it is downgraded by one or two levels will depend on the magnitude of the inconsistency in the results.
Patients vary widely in their pre-intervention or baseline risk of the adverse outcomes that health care interventions are designed to prevent (e.g. death, stroke, myocardial infarction). As a result, risk differences (absolute risk reductions) in subpopulations tend to vary widely. Relative risk (RR) reductions, on the other hand, tend to be similar across subgroups, even if subgroups have substantial differences in baseline risk. Therefore, when we refer to inconsistencies in effect size, we are referring we are referring to relative measures (risk ratios and hazard ratios, which are preferred, or odds ratios).
When easily identifiable patient characteristics confidently permit classifying patients into subpopulations at appreciably different risk, absolute differences in outcome between intervention and control groups will differ substantially between these subpopulations. This may well warrant differences in recommendations across subpopulations, rather than downgrading the quality evidence for inconsistency in effect size.
Although there are statistical methods to measure heterogeneity, there are a variety of other criteria to assess heterogeneity, which can also be used when results cannot be pooled statistically. Criteria to determine whether to downgrade for inconsistency can be applied when results are from more than one study and include:
I2 statistic, which quantifies the proportion of the variation in point estimates due to among-study differences, is large (see note below for decisions based on I2 statistic)
Note:
While determining what constitutes a large I2 value is subjective, the following rule-of thumb can be used:
Overlaps in these ranges, and use of “may be” as terminology, illustrate the uncertainty involved in making such judgments. It is also important to note the implicit limitations in this statistic. When individual study sample sizes are small, point estimates may vary substantially, but because variation can be explained by chance, I2 may be low. Conversely, when study sample sizes are large, a relatively small difference in point estimates can yield a large I2. Another statistic, τ2 (tau square) is a measure of the variability that has an advantage over other measures in that it is not dependent on sample size.
All statistical approaches have limitations, and their results should be seen in the context of a subjective examination of the variability in point estimates and the overlap in CIs.
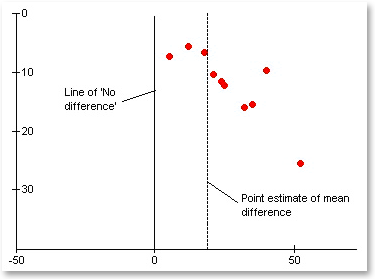
Example 1: Differences in direction, but minimal heterogeneity
Consider the figure below; a forest plot with four studies, two on either side of the line of no effect. We would have no inclination to rate down for inconsistency. Differences in direction, in and of themselves, do not constitute a criterion for variability in effect if the magnitude of the differences in point estimates is small.
[INSERT IMAGE]
Example 2: When inconsistency is large, but differences are between small and large beneficial effects
As we define quality of evidence for a guideline, inconsistency is important only when it reduces confidence in results in relation to a particular decision. Even when inconsistency is large, it may not reduce confidence in results regarding a particular decision. Consider, the figure below in which variability is substantial, but the differences are between small and large treatment effects.
Guideline developers may or may not consider this degree of variability important. Systematic review authors, much less in a position to judge whether the apparent high heterogeneity can be dismissed on the grounds that it is unimportant, are more likely to rate down for inconsistency.
[INSERT IMAGE]
Example 3: Substantial heterogeneity, of unequivocal importance
Consider the figure below. The magnitude of the variability in results is identical to that of the figure presented in Example 2. However, because two studies suggest benefit and two suggest harm, we would unquestionably choose to rate down the quality of evidence as a result of inconsistency.
[INSERT IMAGE]
Example 4: Test a priori hypotheses about inconsistency even when inconsistency appears to be small
A meta-analysis of randomized trials of rofecoxib looking at the outcome of myocardial infarction found apparently consistent results (heterogeneity p=0.82, I2=0%). Yet, when the investigators examined the effect in trials that used an external endpoint committee (RR 3.88, 95% CI: 1.88, 8.02) vs. trials that did not (RR 0.79, 95% CI: 0.29, 2.13), they found differences that were large and unlikely to be explained by chance (p=0.01).
Although the issue is controversial, we recommend that meta-analyses include formal tests of whether a priori hypotheses explain inconsistency between important subgroups even if the variability that exists appears to be explained by chance (e.g. high p-values in tests of heterogeneity, and low I2 values).
If the effect size differs across studies, explanations for inconsistency may be due to differences in:
If inconsistency can be explained by differences in populations, interventions or outcomes, review authors should offer different estimates across patient groups, interventions, or outcomes. Guideline panelists are then likely to offer different recommendations for different patient groups and interventions. If study methods provide a compelling explanation for differences in results between studies, then authors should consider focusing on effect estimates from studies with a lower risk of bias.
If large variability in magnitude of effect remains unexplained and authors fail to attribute it to differences in one of these four variables, then the quality of evidence decreases. Review authors and guideline panels should also consider the extent to which they are uncertain about the underlying effect due to the inconsistency. Uncertainty relates to how important inconsistency is to the confidence in the result. The extent is used to decide whether to downgrade the quality rating by one or even two levels.
Example 5: Making separate recommendations for subpopulations
When the analysis for benefits of endarterectomy was pooled across patients with stenosis of the carotid artery, there was high heterogeneity. Heterogeneity was explored and was explained by separating out patients who were symptomatic with high degree stenosis (in which endarterectomy was beneficial), and patients who were asymptomatic with moderate degree stenosis (in which surgery was not beneficial). The authors presented and graded the evidence by patient group and did not downgrade the quality of the evidence for inconsistency. Two different recommendations were also made according to patient group by the guideline panel.
Finding an explanation for inconsistency is preferable. An explanation can be based on differences in population, intervention, or outcomes which mandate two or more estimates of effect, possibly with separate recommendations. However, subgroups effects may prove spurious and may not explain all the variability in the extent of inconsistency. Indeed, most putative subgroup effects ultimately prove spurious. A cautionary note about subgroup analyses and their presentation is warranted; refer to Sun et al. 2010 and Guyatt et al. 2011 for further reading.
Review authors and guideline developers must exercise a high degree of skepticism regarding potential subgroup effect explanations, paying particular attention to criteria the following 7 criteria:
The credibility of subgroup effects is not a matter of yes or no, but a continuum. Judgement is required to determine how convincing a subgroup analysis is based on the above criteria.
Example 6: Subgroup analysis explaining inconsistency in results
A systematic review and individual patient data meta-analysis (IPDMA) addressed the impact of high vs. low positive end-expiratory pressures (PEEPs) in three randomized trials that enrolled 2,299 adult patients with severe acute lung injury requiring mechanical ventilation.
The results of this IPDMA suggested a possible reduction in deaths in hospital with the higher PEEP strategy, but the difference was not statistically significant (RR 0.94; 95% CI: 0.86, 1.04). In patients with severe disease (labeled acute respiratory distress syndrome), the effect more clearly favored the high PEEP strategy (RR 0.90; 95% CI: 0.81, 1.00; P50.049). In patients with mild disease, results suggested that the high PEEP strategy may be inferior (RR 1.37; 95% CI: 0.98, 1.92).
Applying the seven criteria (see table below), we find that six are met fully, and the seventh, consistency across trials and outcomes, partially: the results of the subgroup analysis were consistent across the three studies, but other ways of measuring severity of lung injury (for instance, treating severity as a continuous variable) failed to show a statistically significant interaction between the severity and the magnitude of effect. In this case, the subgroup analysis is relatively convincing.
[INSERT IMAGE]
Example 7: Subgroup analysis not very likely to explain inconsistency in results
Three randomized trials have tested the effects of vasopressin vs. epinephrine on survival in patients with cardiac arrest. The results show appreciable differences in point estimates, widely overlapping CIs, a p-value for the test of heterogeneity of 0.21 and an I2 of 35%.
Two of the trials included both patients in whom asystole was responsible for the cardiac arrest and the patients in whom ventricular fibrillation was the offending rhythm. One of these two trials reported a borderline statistically significant benefit - our own analysis was borderline nonsignificant - of vasopressin over epinephrine restricted to patients with asystole (in contrast to patients whose cardiac arrest was induced by ventricular fibrillation).
It is not very likely that the subgroup analysis can explain the moderate inconsistency in the results. Chance can explain the putative subgroup effect and the hypothesis fails other criteria (including small number of a priori hypotheses and consistency of effect). Here, guideline developers should make recommendations on the basis of the pooled estimate of data from both the groups. Whether the quality of evidence should be rated down for inconsistency is another judgment call; we would argue for not rating down for inconsistency.
[INSERT IMAGE]
Disclaimer: Section 5.2 has been updated in the new GRADE Book and is available here: https://book.gradepro.org/guideline/indirectness
We are more confident in the results when we have direct evidence. Direct evidence consists of research that directly compares the interventions which we are interested in, delivered to the populations in which we are interested, and measures the outcomes important to patients.
Authors of systematic reviews and guideline panels making recommendations should consider the extent to which they are uncertain about the applicability of the evidence to their relevant question and downgrade the quality rating by one or even two levels.
For authors of systematic reviews:
Directness is judged by the users of evidence tables, depending on the target population, intervention, and outcomes of interest. Authors of systematic reviews should answer the health care question they asked and, thus, they will rate the directness of evidence they found. The considerations made by the authors of systematic reviews may be different than those of guideline panels that use the systematic reviews. The more clearly and explicitly the health care question was formulated the easier it will be for the users to understand systematic review authors' judgments.
There are four sources of indirectness:
1. Differences in population (applicability)
Differences between study populations within a systematic review are a common problem for systematic review authors and guideline panels. When this occurs evidence is indirect. The effect on overall quality of evidence will vary depending on how different the study populations are, as a result quality may not decrease, decrease by a one level or decrease by two levels in extreme cases.
The above discussion refers to different human populations, but sometimes the only evidence will be from animal studies, such as rats or primates. In general, we would rate such evidence down two levels for indirectness. Animal studies may, however, provide an important indication of drug toxicity. Although toxicity data from animals does not reliably predict toxicity in humans, evidence of animal toxicity should engender caution in recommendations. Other types of nonhuman studies (e.g. laboratory evidence) may generate high quality evidence
Example 1: Indirectness in Populations (Downgraded by Two Levels)
High-quality randomized trials have demonstrated the effectiveness of antiviral treatment for seasonal influenza. The panel judged that the biology of seasonal influenza was sufficiently different from that of avian influenza (avian influenza organism may be far less responsive to antiviral agents than seasonal influenza) that the evidence required rating down quality by two levels, from high to low, due to indirectness.
Example 2: Non-human studies providing high quality evidence (Not Downgraded)
Consider laboratory evidence of change in resistance patterns of bacteria to antimicrobial agents (e.g. the emergence of methicillin-resistant staphylococcus aureus - MRSA). These laboratory findings may constitute high quality evidence for the superiority of antibiotics to which MRSA is sensitive vs. methicillin as the initial treatment of suspected staphylococcus sepsis in settings in which MRSA is highly prevalent.
2. Differences in interventions (applicability)
Systematic reviewers will make a concerted effort to ensure that only studies with directly relevant interventions are included in their review. However, exceptions may still occur. Generally, when interventions that are indirectly related to the study are included in systematic review, evidence quality will be decreased. In some instances the intervention used will be the same, but may be delivered in differently depending on the setting.
Example 3: Interventions delivered differently in different settings (Downgraded by One Level)
A systematic review of music therapies for autism found that trials tested structured approaches that are used more commonly in North America than in Europe. Because the interventions differ, the results from structured approaches are more applicable to North America and the results of less structured approaches are more applicable in Europe.
Guideline panelists should consider rating down the quality of the evidence if the intervention cannot be implemented with the same rigor or technical sophistication in their setting as in the RCTs from which the data come.
Example 4: Trials of related interventions (Downgraded by One or Two Levels)
Guideline developers may often find the best evidence addressing their question in trials of related, but different, interventions. A guideline addressing the value of colonoscopic screening for colon cancer will find the randomized control trials (RCTs) of fecal occult blood screening that showed a decrease in colon cancer mortality. Whether to rate down quality by one or two levels due to indirectness in this context is a matter of judgment.
Example 5: Indirectness in Interventions (Not Downgraded)
Older trials show a high efficacy of intramuscular penicillin for gonococcal infection, but guidelines might reasonably recommend alternative antibiotic regimes based on current local in vitro resistance patterns, which would not warrant downgrading the quality of evidence for indirectness.
Example 6: Interventions not sufficiently different (Not Downgraded)
Trials of simvastatin show cardiovascular mortality reduction. Suggesting night rather than morning dosing (because of greater cholesterol reduction) would not warrant rating down quality for differences in the intervention.
3. Differences in outcomes measures (surrogate outcomes)
GRADE specifies that both those conducting systematic reviews and those developing practice guidelines should begin by specifying every important outcome of interest. The available studies may have measured the impact of the intervention of interest on outcomes related to, but different from, those of primary importance to patients.
The difference between desired and measured outcomes may relate to time frame (e.g. outcome measured at 3-months vs. at 12-months). Another source of indirectness related to measurement of outcomes is the use of substitute or surrogate endpoints in place of the patient-important outcome of interest.
|
Table 5.7: Common surrogate measures and corresponding patient-important outcomes |
||
|
Condition |
Patient-important outcome(s) |
Surrogate outcome(s) |
|
Diabetes mellitus |
Diabetic symptoms, hospital admission, complications (cardiovascular, eye, renal, neuropathic) |
Blood glucose, A1C |
|
Hypertension |
Cardiovascular death, myocardial infarction, stroke |
Blood pressure |
|
Dementia |
Patient function, behavior, caregiver burden |
Cognitive function |
|
Osteoporosis |
Fractures |
Bone density |
|
Adult Respiratory Distress Syndrome |
Mortality |
Oxygenation |
|
End-stage renal disease |
Quality of life, morbidity (such as shunt thrombosis or heart failure), mortality |
Hemoglobin |
|
Venous thrombosis |
Symptomatic venous thrombosis |
Asymptomatic venous thrombosis |
|
Chronic respiratory disease |
Quality of life, exacerbations, mortality |
Pulmonary function, exercise capacity |
|
Cardiovascular disease |
Myocardial infarction, vascular events, mortality |
Serum lipids, coronary calcification, calcium/phosphate metabolism |
In general, the use of a surrogate outcome requires rating down the quality of evidence by one, or even two, levels. Consideration of the biology, mechanism, and natural history of the disease can be helpful in making a decision about indirectness. For surrogates that are far removed in the putative causal pathway from the patient-important endpoints, we would rate down the quality of evidence with respect to this outcome by two levels. Surrogates that are closer in the putative causal pathway to the outcomes warrant rating down by only one level for indirectness.
Example 7: Time differences in outcomes (Downgraded by One Level)
A systematic review of behavioral and cognitive-behavioral interventions for outwardly directed aggressive behavior in people with learning disabilities showed that a program of 3-week relaxation training significantly reduced disruptive behaviors at 3 months. Unfortunately, no eligible trial assessed the review authors’ predefined outcome of interest, the long-term impact defined as effect at 9 months or greater. The argument for rating down quality for indirectness becomes stronger when one considers that other types of behavioral interventions have shown an early beneficial effect that was not sustained at 6 months follow-up.
Example 8: Surrogate outcomes (Downgraded by One or Two Levels)
Calcium and phosphate metabolism are far removed in the causal pathway from patient-important outcomes such as myocardial infarction, and warrant rating down the quality of evidence by two levels. Surrogate outcomes that are closer in the causal pathway to the patient-important outcomes such as coronary calcification for myocardial infarction, bone density for fractures, and soft-tissue calcification for pain, warrant rating down quality by one level for indirectness.
Example 9: Uncertainty in the relationship between surrogate and Surrogate outcomes (Downgraded by One or Two Levels)
Investigators examined the “validity” of progression-free survival as a surrogate for overall survival for anthracycline- and taxine-based chemotherapy in advanced breast cancer. They found a statistically significant association between progression-free and overall survival in the randomized trials they analyzed, but predicting overall survival using progression-free survival remained uncertain. Rating down quality by one level for indirectness would be appropriate in this situation.
4. Indirect Comparisons)
Occurs when a comparison of intervention A versus B is not available, but A was compared with C and B was compared with C. Such studies allow indirect comparisons of the magnitude of effect of A versus B. As a result of the indirect comparison, this evidence is of lower quality than head-to-head comparisons of A and B would provide.
The validity of the indirect comparison rests on the assumption that factors in the design of the trial (the patients, co-interventions, measurement of outcomes) and the methodological quality are not sufficiently different to result in different effects (in other words, true differences in effect explain all apparent differences). Some authors refer to this as the “similarity assumption”. Because this assumption is always in some doubt, indirect comparisons always warrant rating down by one level in quality of evidence. Whether to rate down two levels depends on the plausibility that alternative factors (population, interventions, co-interventions, outcomes, and study methods) explain or obscure differences in effect.
Example 10: Indirect comparison of low- vs. medium-dose aspirin (Downgraded by One Level)
A systematic review considered the relative merits of low dose vs. medium dose of aspirin to prevent graft occlusion after coronary artery bypass surgery. Authors found five relevant trials that compared aspirin with placebo, of which two tested medium dose and three low-dose aspirin. The pooled relative risk of the likelihood of a graft occlusion was 0.74 (95% CI: 0.60, 0.91) in the low-dose trial and 0.55 (95% CI: 0.28, 0.82) in the medium-dose trials. The RR of medium vs. low dose was 0.74 (95% CI: 0.52, 1.06; P = 0.10) suggesting the possibility of a larger effect with the medium-dose regimens. This comparison is weaker than if the randomized trials had compared the two aspirin dose regimens directly because there are other study characteristics that might be responsible for any differences found.
Example 11: Network meta-analysis (Downgraded by Two Levels)
Investigators conducted a simultaneous treatment comparison of 12 new generation antidepressants. The authors evaluated 117 randomized trials involving over 25,000 patients; their article provides no information about the similarity of the patients, or about co-intervention. In correspondence with the authors, however, they indicated that they excluded trials with treatment-resistant depression, argued that different types of depression have similar treatment responses, and that it is very likely that patients did not receive important co-intervention. With respect to risk of bias, the authors tell us, using the Cochrane collaboration approach to assessing risk of bias that risk of bias in most studies was “unclear”, and 12 were at low risk of bias; presumably a small number was at high risk of bias. This is helpful, although “unclear” represents a wide range of risk of bias. All studies involved head-to-head comparisons between at least two of the 12 drugs; the 117 trials involved 70 individual comparisons (e.g., two comparisons between fluoxetine and fluvoxamine). The authors reported statistically significant differences between direct and indirect comparisons in only three of 70 comparisons of drug response. The power of such tests was, however, not likely high. Overall, we would be inclined to take a cautious approach to this network meta-analysis and rate down two levels for indirectness.
Disclaimer: Section 5.2 has been updated in the new GRADE Book and is available here: https://book.gradepro.org/guideline/imprecision
In general, results are imprecise when studies include relatively few patients and few events and thus have a wide confidence interval (CI) around the estimate of the effect. In this case, one may judge the quality of the evidence lower than it otherwise would be considered because of resulting uncertainty about the results.
In addition to describing how the 95% confidence interval should be used as the primary criterion to make judgements about imprecision, we introduce theoptimal information size (OIS) as a second, necessary criterion for determining adequate precision.
Because GRADE defines the quality of evidence differently for systematic reviews and for guidelines, the criteria for downgrading for imprecision differ in that guideline panels need to consider the context of a recommendation and other outcomes, whereas judgments about specific outcomes in a systematic review are free of that context. The GRADE approach, therefore, suggests separate guidance for determining imprecision as is described in the following sections.
For guideline panels:
Quality of evidence refers to the extent to which our confidence in the estimate of an effect is adequate to support a particular decision. In guidelines all outcomes are considered together, with attention to whether they are critical, or important but not critical.
For guideline panels, the decision to rate down the quality of evidence for imprecision is dependent on the threshold that represents the basis for a management decision and consideration of the trade-off between desirable and undesirable consequences. Determining the acceptable threshold inevitably involves judgement that must be made explicit.
For dichotomous outcomes
Guideline developers must consider the context of the particular recommendation to determine whether the results of a dichotomous (binary) outcome are sufficiently precise to support that recommendation. Setting a specific threshold for an acceptable estimate of treatment effect will involve judgement in the context of factors such as side effects, drug toxicity, and cost (see Example 1). Examining the lower and upper boundaries of the CI in relation to the threshold set by the guideline panel, then determining whether criteria for the optimal information size are met, will help in deciding whether to rate down for imprecision.
We suggest that guideline developers consider the following steps in deciding whether to rate down the quality of evidence for imprecision in guidelines:
While confidence intervals mostly capture the extent of imprecision, they can be misleading in certain circumstances because of fragility. Specifically, CIs may appear robust, but small numbers of events may render the results fragile. Confidence intervals assume all patients are at the same risk (i.e. there is prognostic balance), an assumption that is false. Randomization will ameliorate the problem by balancing prognostic factors between intervention and control groups, but we can be confident that a prognostic balance has been achieved only if sample sizes are large. Large treatment effects in the presence of small sample sizes, even in RCTs, may be because of prognostic imbalance and warrant caution.
Early trials addressing a particular question will, particularly if small, substantially overestimate the treatment effect. A systematic review of these trials will subsequently also generate an overestimated treatment effect. Examples of meta-analyses generating apparent beneficial or harmful effects refuted by subsequent larger trials include magnesium for mortality reduction after myocardial infarction, angiotensin-converting enzyme inhibitors for reducing the incidence of diabetes, nitrates for mortality reduction in myocardial infarction, and aspirin for reduction of pregnancy-induced hypertension. A similar circumstance occurs when trials are stopped early for benefit (i.e. prior to reaching the total number of events, or the sample size, needed as was calculated for an adequately powered trial). Simulation studies and empirical evidence suggest that trials stopped early overestimate treatment effects (see Example 4). When a treatment effect is overestimated, the CI around the effect may falsely appear suitable to meet the clinical decision threshold criterion by indicating adequate precision.
Therefore, the clinical decision threshold criterion is not completely sufficient to deal with issues of precision, and the second OIS criterion is required.
Note: The Optimal Information Size (OIS)
In order to address the vulnerability of confidence intervals as a criterion for adequate precision, we suggest the “optimal information size” as a second, necessary criterion to consider. The OIS is applied as a rule according to the following:
Many online calculators for sample size calculation are available. A simple one can be found at http://www.stat.ubc.ca/rollin/stats/ssize/b2.html. As an alternative to calculating the OIS, guideline developers can also consult figures that show the relationship between sample size required, or number of events needed, and effect size. See Example 2 demonstrating how these figures can be used.
Exception: Low event rates with large sample size, an exception to the need for OIS
When event rates are low, CIs around relative effects may be wide, but if sample sizes are sufficiently large, it is likely that prognostic balance has indeed been achieved and CIs around absolute effects may be narrow. Under such circumstances, judgment about precision may be based on the CI around the absolute effect and one may not downgrade the quality of evidence for imprecision. (see Examples 5 and 6)
Example 1: Setting clinical decision thresholds to determine imprecision in guidelines
Refer to the figure below. A hypothetical systematic review of randomized control trials of an intervention to prevent major strokes yields a point estimate of the absolute reduction in strokes of 1.3%, with a 95% CI of 0.6% to 2.0%. This translates to a number needed to treat (NNT) of 77 (100÷1.3) patients for a year to prevent a single stroke. The 95% CI around the NNT is 50 to 167. Therefore, while 77 is our best estimate, we may need to treat as few as 50 or as many as 167 people to prevent a single stroke.
[INSERT IMAGE]
If we consider that the intervention is a drug with no serious adverse effects, minimal inconvenience, and modest cost, we may set a threshold for an absolute reduction in strokes of 0.5%, or NNT=200 (green line in the figure above), as even this small effect would warrant a recommendation. The entire CI (0.6% to 2.0%) lies to the left of the 0.5% threshold and, therefore, excludes any benefit smaller than the threshold. We can conclude that the precision of the evidence is sufficient to support a recommendation and do not rate down the quality of evidence for imprecision.
On the other hand, if the drug is associated with serious toxicity, we may be reluctant to make a recommendation unless the absolute stroke reduction is at least 1%, or NNT=100 (red line in the figure above). Under these circumstances, the precision is insufficient as the CI encompasses treatment effects smaller than this threshold (i.e. as small as 0.6%). A recommendation in favour of the intervention would still be appropriate as the point estimate of 1.3% meets the threshold, but we would rate down the quality of evidence supporting the recommendation by one level for imprecision (e.g. from high to moderate).
Example 2: Using figures to determine Optimal Information Size
As an alternative to calculating the OIS, review and guideline authors can also consult a figure to determine the OIS. The figure below presents the required sample size (assuming α of 0.05, and β of 0.2) for RRR of 20%, 25%, and 30% across varying control group risks. For example, if the best estimate of control group risk was 0.2 and one specifies an RRR of 25%, the OIS is approximately 2000 patients.
[INSERT IMAGE]
Power is, however, more closely related to number of events than to sample size. The figure below presents the same relationships using total number of events across all studies in both treatment and control groups instead of total number of patients. Using the same choices of a control group risk of 0.2 and RRR 25%, one requires approximately 325 events to meet OIS criteria.
[INSERT IMAGE]
Note: Choice of Relative Risk Reduction
We have suggested using RRRs of 20% to 30% for calculating OIS. The choice of RRR is a matter of judgment, and there may be instances in which compelling prior information would suggest choosing a smaller or larger value for the RRR for the OIS calculation.
Example 3: Applying the OIS Criterion
A systematic review of flavonoids for treatment of hemorrhoids examined the outcome of failure to achieve an important symptom reduction. In calculating the OIS, the authors chose a conservative α of 0.01 and RRR of 20%, a β of 0.2, and a control group risk of 50%. The calculated OIS was marginally larger than the total sample size included (1194 vs. 1102 patients).
A more dramatic example comes from a systematic review and meta-analysis of fluoroquinolone prophylaxis for patients with neutropenia. Only one of eight studies that contributed to the meta-analysis met conventional criteria for statistical significance, but the pooled estimate suggested an impressive and robust reduction in infection-related mortality with prophylaxis (RR: 0.38; 95% CI: 0.21, 0.69). The total number of events was only 69 and the total number of patients 1022. Considering the control group risk of 6.9% and setting α of 0.05, β of 0.02, and RRR of 25% results in an OIS of 6400 patients. This meta-analysis fails to meet OIS criteria, and rating down for imprecision may be warranted.
Example 4: Stopping trials early may result in overestimated treatment effects and incorrect judgements about precision
Consider a randomized trial of β blockers in 112 patients undergoing surgery for peripheral vascular diseases that fulfilled preplanned O’Briene-Fleming criteria for early stopping. Of 59 patients given bisoprolol, 2 suffered a death or nonfatal myocardial infarction, as did 18 of 53 control patients. Despite a total of only 20 events, the 95% CI around the RR (0.02 to 0.41) excludes all but a large treatment effect. The CI suggests that the smallest plausible effect is a 59% RRR. A recommendation to administer treatment based on this result would be deemed to have adequate precision.
However, there are reasons to doubt the estimate of the magnitude of effect from this trial. First, it is much larger than what we might expect on the basis of β blockers effects in a wide variety of other situations. Second, the study was terminated early on the basis of the large effect. Third, we have a sense of the fragility of these results as concluding that an RRR less than 59% is implausible on the basis of only 20 events violates common sense. If one moves just five events from the control to the intervention group, the results lose their statistical significance, and the new point estimate (an RRR of 52%) is outside of the original CI.
Example 5: Focusing on absolute effects when event rates are low and sample size is large
A systematic review of seven randomized trials of angioplasty versus carotid endarterectomy for cerebrovascular disease found that a total of 16 of 1482 (1.1%) patients receiving angioplasty died, as did 19 of 1465 (1.3%) undergoing endarterectomy. Looking at the 95% CI (0.43, 1.66) around the point estimate of the RR (0.85), the results are consistent with substantial benefit and substantial harm, suggesting the need to rate down for imprecision.
The absolute difference, however, suggests a different conclusion. The absolute difference in death rates between the two procedures is very small (absolute difference of 0.2% with a 95% CI ranging from -0.5% to 1.0%). Setting a clinical decision threshold boundary of 1% absolute difference (the smallest difference important to patients), the results of the systematic review exclude a difference favoring either procedure. If one accepted this clinical decision threshold as appropriate, one would not rate down for imprecision. One could argue that a difference of less than 1% could be important to patients: if so, one would rate down for imprecision, even after considering the CI around the absolute difference, as the CI would cross that threshold.
Example 6: No need to rate down for imprecision when sample sizes are very large
A meta-analysis of randomized trials of β blockade for preventing cardiovascular events in patients undergoing non-cardiac surgery suggested a doubling of the risk of strokes with β blockers (RR: 2.22; 95% CI: 1.39, 3.56). Most trials in this meta-analysis do not suffer from important limitations, the evidence is direct and consistent, and publication bias is undetected. Given the lower boundary of the CI (an increase in RR of 39%), the threshold for adequate precision would not be crossed if one believed that most patients would be reluctant to use β blockers with an increase in RR of stroke of 39%.
The total number of events (75), however, appears insufficient, an inference that is confirmed with an OIS calculation (α 0.05, β 0.20, using the β-blocker group’s 1% event rate as the control, and Δ 0.25, total sample size 43586 in comparison to the 10889 patients actually enrolled). The guidelines for calculating precision we have suggested would, therefore, mandate rating down quality for imprecision.
With a sample size of over 5000 patients per group, however, it is very likely that randomization has succeeded in creating prognostic balance. If that is true, β blockers really do increase the risk of stroke. Not rating down for imprecision in this situation is therefore appropriate. Preliminary information suggests that for low baseline risk (<5%) one will be safe with regard to prognostic balance with a total of 4000 patients (2000 patients per group). Availability of this number of patients would mandate not rating down for imprecision despite not meeting the OIS criterion.
For continuous outcomes
Considerations of rating down quality because of imprecision for continuous variables follow the same logic as for binary variables. The process begins by rating down the quality for imprecision if a recommendation would be altered if the lower versus the upper boundary of the CI represented the true underlying effect. If the CI does not cross this threshold, but the evidence fails to meet the OIS criterion, guideline authors should consider rating down the quality of evidence for imprecision. In this instance, judging the OIS criterion will require a sample size calculation for the continuous variable.
In the context of a guideline, the decision-making threshold for an acceptable estimate of treatment requires consideration of the full context of the recommendation, including other outcomes such as all potential benefits and important adverse effects (see Example 7).
Example 7: Considering the full context of a recommendation
A systematic review suggests that corticosteroid administration decreases the length of hospital stay in patients with exacerbations of chronic obstructive pulmonary disease (COPD) by 1.42 days (95% CI: 0.65, 2.2). The lower boundary of the CI is 0.65 days, a rather small effect size that may not be considered important to patients.
As it turns out, steroids also reduce the likelihood of treatment failure (variably defined) during inpatient or outpatient follow-up (RR: 0.54; 95% CI: 0.41, 0.71). The best estimate of likelihood of symptomatic deterioration in those not treated with steroids is approximately 30%. By administering steroids to these patients, the risk is reduced from 30% to 16% (30-[0.54x30]), a difference of 14%, and the effect is unlikely to be less than 9% (30-[0.71x30]).
Adverse effects were poorly reported in the studies. The only consistently reported problem was hyperglycemia, which was increased almost sixfold, representing an absolute increase of 15% to 20%. The extent to which this hyperglycemia had consequences important to patients is uncertain. One possible conclusion from this information is that, given the magnitude of reduction in deterioration and lack of evidence suggesting important adverse effects, a benefit of even 0.65 days of reduced average hospitalization would warrant steroid administration. If this were the conclusion, the CI (0.65, 2.2) would not cross the decision-making threshold and the guideline panel would proceed to consider whether the evidence meets the OIS criterion.
For authors of systematic reviews:
Quality of evidence refers to one's confidence in the estimates of effect. In systematic reviews each outcome is considered separately.
Authors of systematic reviews should not rate down quality due to imprecision on the basis of the trade-off between desirable and undesirable consequences; it is not their job to make value and preference judgments. Therefore, in judging precision, they should not focus on the threshold that represents the basis for a management decision. Rather, they should consider the optimal information size to make judgements.
For dichotomous outcomes
We suggest that authors of systematic reviews consider the following steps in deciding whether to rate down the quality of evidence for imprecision:
Note:
To be of optimal use to guideline developers, a systematic review may still point out what thresholds of benefit would mandate rating down for imprecision.
Example 8: Meeting threshold OIS may not ensure precision
Although satisfying the OIS threshold in the presence of a CI excluding no effect indicates adequate precision, the same is not true when the point estimate fails to exclude no effect.
Consider the systematic review of β blockers in non-cardiac surgery previously introduced in Example 6 above. For total mortality, with 295 deaths and a total sample size of over 10000, the point estimate and 95% CI for the RR with β blockers were 1.24 (95% CI: 0.99, 1.56). Despite the large sample size and number of events, one might be reluctant to conclude precision is adequate when a small reduction in mortality with β blockers, as well as an increase of 56%, remain plausible. This suggests that when the OIS criteria are met, and the CI includes the null effect, systematic review authors should consider whether CIs include appreciable benefit or harm.
Authors should use their judgment in deciding what constitutes appreciable benefit and harm and provide a rationale for their choice. If reviewers fail to find a compelling rationale for a threshold, our suggested default threshold for appreciable benefit and harm that warrants rating down is an RRR or RR increase of 25% or more.
For continuous outcomes
Review authors can calculate the OIS for continuous variables in exactly the same way they can for binary variables by specifying the α and β error thresholds (we have suggested 0.05 and 0.2) and the Δ, and choosing an appropriate population standard deviation based on one of the relevant studies.
Whether you will rate down for imprecision is dependent on the choice of the difference (Δ) you wish to detect and the resulting sample size required. Again, the merit of the GRADE approach is not that it ensures agreement between reasonable individuals, but that the judgements being made are explicit.
Example 9: Judgements about imprecision depend on the choice of difference to detect
Consider the systematic review previously introduced in Example 7 above, which suggests that corticosteroid administration decreases the length of hospital stay in patients with exacerbations of chronic obstructive pulmonary disease (COPD) by 1.42 days (95% CI: 0.65, 2.2).
Choosing a Δ of 1.0 (implying a judgment that reductions in stay of more than a day are important) and using the standard deviation associated with hospital stay in the four relevant studies (3.4, 4.5, and 4.9) yields corresponding required total sample sizes of 364, 636, and 754. The 602 patients available for this analysis do not therefore meet the OIS criterion, and one would consider rating down for imprecision.
Had we chosen a smaller difference (e.g. 0.5 days) that we wished to detect, the sample size of the studies would have been unequivocally insufficient. Had we chosen a larger value (e.g. 1.5 days) the sample size of 602 would have met the OIS criterion.
Note: Outcomes reported as a standardized mean difference
A particular challenge in calculating the OIS for continuous variables arises when studies have used different instruments to measure a construct, and the pooled estimate is calculated using a standardized mean difference. Systematic review and guideline authors will most often face this situation when dealing with patient-reported outcomes, such as quality of life. In this context, we suggest authors choose one of the available instruments (ideally, one in which an estimate of the minimally important difference is available) and calculate an OIS using that instrument.
Because it may give false reassurance, we hesitate to offer a rule-of-thumb threshold for the absolute number of patients required for adequate precision for continuous variables. For example, using the usual standards of α (0.05) and β (0.20), and an effect size of 0.2 standard deviations, representing a small effect, requires a total sample size of approximately 400 (200 per group), sample size that may not be sufficient to ensure prognostic balance.
Nonetheless, whenever there are sample sizes that are less than 400, review authors and guideline developers should certainly consider rating down for imprecision. In future, statistical simulations may provide the basis for a robust rule of thumb for continuous outcomes. The limitations of an arbitrary threshold sample size suggest the advisability of addressing precision by calculation of the relevant OIS for each continuous variable.
When there are very few events and CIs around both relative and absolute estimates of effect, that include both appreciable benefit and appreciable harm, systematic reviewers and guideline developers should consider rating down the quality of evidence by two levels.
Example 10: Rating down for imprecision by two levels
A systematic review of the use of probiotics for induction of remission in Crohn’s disease found a single randomized trial that included 11 patients. Four of five patients in the treatment group achieved remission, and five of six patients in the control group achieved remission. The point estimate of the risk ratio (0.96) suggests no difference, but the CI includes a reduction in likelihood of remission of almost half, or an increase in the likelihood of over 50% (95% CI: 0.56, 1.69). As there are few events and the CI includes appreciable benefit and harm, one would rate down quality of evidence by two levels for imprecision.
Disclaimer: Section 5.2 has been updated in the new GRADE Book and is available here: https://book.gradepro.org/guideline/dissemination-bias
Publication bias is a systematic under-estimation or an over-estimation of the underlying beneficial or harmful effect due to the selective publication of studies. Confidence in the combined estimates of effects from a systematic review can be reduced when publication bias is suspected, even when the included studies themselves have a low risk of bias.
Note:
Some systems for assessing the quality of the body of evidence use the term “reporting bias” with 2 subcategories: selective outcome reporting and publication bias. However, GRADE considers selective outcome reporting under risk of bias (study limitations) since it can be addressed in single studies. In contrast, when an entire study remains unpublished (unreported), one can assess the likelihood of publication bias only by looking at a group of studies. Currently, GRADE follows the Cochrane Collaboration’s approach and consider selective outcome reporting as an issue in risk of bias in individual studies (Cochrane Handbook. Chapter 8.5 The Cochrane Collaboration’s tool for assessing risk of bias).
Empirical evidence suggests that studies reporting statistically significant findings are more likely to be accepted for publication than those reporting statistically insignificant findings (“negative studies”). Publication bias arises when entire studies go unreported. Lack of success to identify studies is typically a result of studies either remaining unpublished or obscurely published (e.g. in journals with limited circulation not indexed by major databases, as conference abstracts or theses), thus, methodologists have labeled the phenomenon “publication bias.” Authors of systematic reviews may fail to identify studies that are unpublished or that have been published in a non-indexed, limited-circulation journal or in the grey literature even if they employ most rigorous search techniques. If rigorous search techniques are not implemented it is difficult to make the judgement about publication bias since studies might remain unidentified both because of publication bias or because of insufficient effort to identify them.
The risk of publication bias may be higher for systematic reviews of observational studies than for reviews of RCTs. This can occur, especially if observational studies are conducted automatically from patient registries or medical records. In these instances, it is difficult for the reviewer to know if the observational studies that appear in the literature represent all or a fraction (usually those that showed “interesting” results) of the studies conducted.
|
Table 5.8: Possible sources of publication bias throughout the publication process |
|
|
Phases of research publication |
Actions contributing to or resulting in bias. |
|
Preliminary and pilot studies |
Small studies more likely to be “negative” (e.g. those with discarded or failed hypotheses) remain unpublished; companies classify some as proprietary information. |
|
Report completion |
Authors decide that reporting a “negative” study is uninteresting; and do not invest the time and effort required for submission. |
|
Journal selection |
Authors decide to submit the “negative” report to a nonindexed, non-English, or limited-circulation journal. |
|
Editorial consideration |
Editor decides that the “negative” study does not warrant peer review and rejects manuscript. |
|
Peer review |
Peer reviewers conclude that the “negative” study does not contribute to the field and recommend rejecting the manuscript. Author gives up or moves to lower impact journal. Publication delayed. |
|
Author revision and resubmission |
Author of rejected manuscript decides to forgo the submission of the “negative” study or to submit it again at a later time to another journal (see “journal selection” above). |
|
Report publication |
Journal delays the publication of the “negative” study. Proprietary interests lead to report getting submitted to, and accepted by, different journals. |
Studies with small sample sizes are more likely to remain unpublished or ignored. Discrepancies between results of meta-analyses of small studies and subsequent large trials may occur as often as 20% of the time, and publication bias may be a major contributor to such discrepancies. Therefore, one should suspect publication bias when published evidence is limited to a small number of small trials. This is especially true if many of these small studies show benefits of certain intervention.
Methods to detect the possibility of publication bias in systematic reviews include visual inspection and tests for asymmetry of funnel plots (Cochrane Handbook. Chapter 10.4 Detecting reporting biases). Empirical examination of patterns of results may suggest publication bias if results are asymmetrical about the summary estimate of effect. This can be determined either through visual inspection of a funnel plot (shown below) or from a positive result for a statistical test for asymmetry. As a rule-of-thumb, funnel plot and statistical tests for asymmetry should be used to detect publication bias if there are at least 10 studies included in the meta-analysis (some say at lest 5 studies).
Another test used to detect publication bias is referred to as the “trim and fill” method is an extension of the funnel plot. This trim and fill technique begins by removing small “positive” studies that do not have a negative counterpart, leaving a symmetrical funnel plot. The new supposed true effect is then calculated using the effects of the studies included in the new funnel plot. The next step is to add hypothetical studies which mirror the results of the positive studies, but still retains the new pooled effect estimate. It is important to note that even if asymmetry is detected, it may not be the result of publication bias. For example, in smaller studies, over-estimates of effect may yield an asymmetric funnel plot that could be explained by limitations other than publication bias such as a restrictive study population. To strengthen conclusions regarding publication bias it is recommended that multiple tests be used.
Recursive cumulative meta-analysis, used to detect lag time bias, performs a meta-analysis at the end of each year, noting changes in effect estimates for each progressing year. If effects of an intervention continuously decrease, there is a strong indication of lag time bias.
Regardless of the test used, review authors and guideline developers should be aware such tests can be prone to error and their results should be interpreted with caution. It is extremely difficult to be confident that publication bias is absent and almost as difficult to place a threshold on when to rate down quality of evidence due to the strong suspicion of publication bias. For this reason GRADE suggests rating down quality of evidence for publication bias by a maximum of one level.
Example 1: Trials with positive findings (i.e. statistically significant differences) are more likely to be published than trials with negative or null findings
A systematic review assessed the extent to which publication of a cohort of clinical trials is influenced by the statistical significance, perceived importance, or direction of their results. It found five studies that investigated these associations in a cohort of registered clinical trials. Trials with positive findings were more likely to be published than trials with negative or null findings (odds ratio: 3.9; 95% CI: 2.7 to 5.7). This corresponds to a risk ratio of 1.8 (95% CI: 1.6 to 2.0), assuming that 41% of negative trials are published (the median among the included studies, range = 11% to 85%). In absolute terms, this means that if 41% of negative trials are published, we would expect that 73% of positive trials would be published. Two studies assessed time to publication and showed that trials with positive findings tended to be published after 4 to 5 years compared with those with negative findings, which were published after 6 to 8 years. Three studies found no statistically significant association between sample size and publication. One study found no statistically significant association between either funding mechanism, investigator rank, or sex and publication.
Systematic reviews performed early in the development of a body of research may be biased due to the tendency for positive results to be published sooner and for negative results to be published later or withheld. This is referred to as “lag bias” and especially true of industry funded studies.
Example 3: Reduced effect estimate in a systematic review as a result of negative studies not being published
An investigation of 74 antidepressant trials with a mean sample size of fewer than 200 patients was submitted to the FDA. Of the 38 studies viewed as positive by the FDA, 37 were published. Of the 36 studies viewed as negative by the FDA, only 14 were published. Publication bias of this magnitude can seriously bias effect estimates.
Example 5: Funnel plots to detect publication bias
In A, the circles represent the point estimates of the trials. The pattern of distribution resembles an inverted funnel. Larger studies tend to be closer to the pooled estimate (the dashed line). In this case, the effect sizes of the smaller studies are more or less symmetrically distributed around the pooled estimate.
In B, publication bias is detected. This funnel plot shows that the smaller studies are not symmetrically distributed around either the point estimate (dominated by the larger trials) or the results of the larger trials themselves. The trials expected in the bottom right quadrant are missing. One possible explanation for this set of results is publication bias - an overestimate of the treatment effect relative to the underlying truth.
Example 6: Publication bias detected
A number of small trials from a systematic review of oxygen therapy in patients with chronic obstructive pulmonary disease showed that the intervention improved exercise capacity, but evaluation of the data suggested publication bias.
The funnel plot of exercise distance shows distance on the x-axis and variance on the y-axis. The red dots represent the mean differences of individual trial estimates and the dotted line the point estimate of the mean effect indicating benefit from oxygen treatment. The distribution of these dots to the right of the dotted line suggests that there may be the equivalent number of ’negative’ trials that have not been included in this analysis. Thus, one may downgrade the quality of evidence in this case due to uncertainty resulting from asymmetry in the pattern of results.
Example 8: Publication bias undetected
A systematic review of parenteral anticoagulation for prolonged survival in patients with cancer who had no other indication for anticoagulation shows five RCTs which are symmetrically distributed around the best estimate of effect. Publication bias is undetected in this scenario and thus the evidence should not be downgraded.
When to downgrade the quality of evidence because of suspicion of publication bias
Guideline panels and authors of systematic reviews should consider the extent to which they are uncertain about the magnitude of the effect due to selective publication of studies and they may downgrade the quality of evidence by one level. Consider:
Consideration of factors reducing quality of evidence must precede consideration of reasons for rating it up. Thus, consideration of all our previously presented criteria for rating down certainty of evidence (risk of bias, imprecision, inconsistency, indirectness, and publication bias) must precede consideration of reasons for rating it up. The decision to rate up should only rarely be made if serious limitations are present in any of these areas. In particular, decisions to rate up because of large or very large effects should consider not only the point estimate but also the width of the CI around that estimate of an effect: one should rarely rate up for large effects if the CI overlaps substantially with effects smaller than the chosen threshold. The following sections discuss in detail the 3 factors that permit rating up the quality of evidence, i.e. increase confidence in an estimate of an effect. Using the GRADE framework, body of evidence from observational studies is initially classified as low quality evidence (i.e. permitting low confidence in the estimated effect). There are times, however, when we have high confidence in the estimate of effect from observational studies (including cohort, case-control, before-after, time series studies, etc.) and to non-randomized experimental studies (e.g. quasi-randomized and non-randomized controlled trials). The circumstances under which the body of evidence from observational studies may provide higher than low confidence in the estimated effects will likely occur infrequently.
Note: Although it is theoretically possible to rate up results from randomized control trials, we have yet to find a compelling example of such an instance.
When body of evidence from observational studies not downgraded for any of the 5 factors yield large or very large estimates of the magnitude of an intervention effect, then we may be more confident about the results. In those situations, even though observational studies are likely to provide an overestimate of the true effect, the study design that is more prone to bias is unlikely to explain all of the apparent benefit (or harm). Decisions to rate up quality of evidence because of large or very large effects (Table 5.9) should consider not only the point estimate but also the precision (width of the CI) around that effect: one should rarely and very cautiously rate up quality of evidence because of apparent large effects, if the CI overlaps substantially with effects smaller than the chosen threshold of clinical importance.
|
Table 5.9. Definitions of large and very large effect |
||
|
Magnitude of Effect |
Definition |
Quality of Evidence |
|
Large |
RR* >2 or <0.5 (based on direct evidence, with no plausible confounders) |
may increase 1 level |
|
Very large |
RR* >5 or <0.2 (based on direct evidence with no serious problems with risk of bias or precision, i.e. with (sufficiently narrow confidence intervals) |
may increase 2 levels |
|
* Note: these rules apply when effect measure is expressed as relative risk (RR) or hazard ratio (HR). They cannot always be applied when the effect measure is expressed as odds ratio (OR). We suggest converting OR to RR and only then assessing the magnitude of an effect. |
||
One may be more likely to rate up the quality of evidence because of large or very large magnitude of an effect, when:
Note: When outcomes are subjective it is important to be cautious when considering upgrading because of observed large effects. This is especially true when outcome assessors were aware which group study subjects belonged to (i.e. were not blinded).
Examples
A systematic review of observational studies examining the relationship between infant sleeping position and sudden infant death syndrome (SIDS) found an odds ratio of 4.1 (95% CI: 3.1, 5.5) of SIDS occurring with front vs. back sleeping positions. Furthermore, “back to sleep” campaigns that were started in the 1980s to encourage back sleeping position were associated with a relative decline in the incidence of SIDS by 50-70% in numerous countries.
The presence of a dose-response gradient has long been recognized as an important criterion for believing a putative cause-effect relationship. The presence of a dose-response gradient may increase our confidence in the findings of observational studies and thereby increase the quality of evidence.
Example 1: Dose-response gradient (Upgraded by One Level)
The observation that, in patients receiving anticoagulation with warfarin, there is a dose response gradient between higher levels of the international normalized ratio (INR), an indicator of the degree of anticoagulation, and an increased risk of bleeding increases our confidence that supratherapeutic anticoagulation levels increase bleeding risk.
Example 2: Dose-response gradient (Upgraded by One Level)
The dose-response gradient associated with the rapidity of antibiotic administration in patients presenting with sepsis and hypotension may also be a reason to upgrade the quality of evidence for such a study. There is a large absolute increase in mortality with each hour’s delay of antibiotic administration. This dose-response relationship increases our confidence that the effect on mortality is real and substantial leading to upgrading the quality of the evidence.
On occasion, all plausible residual confounding from observational studies may be working to reduce the demonstrated effect or increase the effect, if no effect was observed.
Rigorous observational studies will accurately measure prognostic factors associated with the outcome of interest and will conduct an adjusted analysis that accounts for differences in the distribution of these factors between intervention and control groups. The reason that in most instances we consider observational studies as providing only low-quality evidence is that unmeasured or unknown determinants of outcome unaccounted for in the adjusted analysis are likely to be distributed unequally between intervention and control groups, referred to as “residual confounding” or “residual biases.”
On occasion, all plausible confounders (biases) from observational studies unaccounted for in the adjusted analysis (i.e. residual confounders) of a rigorous observational study would result in an underestimate of an apparent treatment effect. If, for instance, only sicker patients receive an experimental intervention or exposure, yet they still fare better, it is likely that the actual intervention or exposure effect is even larger than the data suggest. A parallel situation exists when observational studies have failed to demonstrate an association.
Example 1: When confounding is expected to reduce a demonstrated effect (Upgraded by One Level)
A rigorous systematic review of observational studies including a total of 38 million patients demonstrated higher death rates in private for-profit versus private not-for-profit hospitals. It is likely, however, that patients in the not-for-profit hospitals were sicker than those in the for-profit hospitals. This would bias results against the not-for-profit hospitals. The second likely bias was the possibility that higher numbers of patients with excellent private insurance coverage could lead to a hospital having more resources and a spill-over effect that would benefit those without such coverage. Since for-profit hospitals are likely to admit a larger proportion of such well-insured patients than not-for-profit hospitals, the bias is once again against the not-for-profit hospitals. Because the plausible biases would all diminish the demonstrated intervention effect, one might consider the evidence from these observational studies as moderate rather than low quality.
Example 2: When confounding is expected to reduce a demonstrated effect (Upgraded by One Level)
In a systematic review investigating the use of condoms in homosexual male relationships as a way of preventing the spread of HIV, five observational studies were identified. The pooled estimate was a relative risk of 0.34 (95%, 0.21 – 0.54) in favour of condom use. The authors failed to adjust in the analysis for the fact that condom users are more likely to have more partners than non-condom users. One would expect that more partners would have increased the risk of acquiring HIV and therefore reduced the resulting relative risk of HIV infection. Therefore, the confidence in this effect, which is still large, would lead to upgrading by one level.
Example 3: When confounding is expected to increase the effect but no effect was observed (Upgraded by One Level)
The hypoglycaemic drug phenformin causes lactic acidosis, and the related agent metformin is under suspicion for the same toxicity. Very large observational studies have failed to demonstrate an association between metformin and lactic acidosis. Given the likelihood that clinicians would have been more alert to lactic acidosis with metformin and would have therefore over-reported its occurrence, and that no association was found, one could upgrade this evidence.
Example 4: When confounding is expected to increase the effect but no effect was observed (Upgraded by One Level)
Consider the early reports associating MMR vaccination with autism. One would think that there would be over-reporting of autism in children given MMR vaccines. However, systematic reviews failed to prove any association between the two. Due to the negative results, despite the potential presence of confounders which would increase the likelihood of reporting of autism, no association was found. Therefore, we may upgrade the level of evidence by one level.
The overall quality of evidence is a combined rating of the quality of evidence across all outcomes considered critical for answering a health care question (i.e. making a decision or a recommendation).
We caution against a mechanistic approach toward the application of the criteria for rating the quality of the evidence up or down. Although GRADE suggests the initial separate consideration of five categories of reasons for rating down the quality of evidence, and three categories for rating it up, with a yes/no decision regarding rating up or down in each case, the final rating of overall evidence quality occurs in a continuum of confidence in the estimates of effects.
For authors of systematic reviews:
Authors of systematic reviews do not grade the overall quality of evidence across outcomes. Because systematic reviews do not – or at least should not – make recommendations, authors of systematic reviews rate the quality of evidence only for each outcome separately.
For guideline panels and others making recommendations:
Guideline panels have to determine the overall quality of evidence across all the critical outcomes essential to a recommendation they make. Guideline panels provide a single grade of quality of evidence for every recommendation, but the strength of a recommendation usually depends on evidence regarding not just one, but a number of patient-important outcomes and on the quality of evidence for each of these outcomes.
Because the GRADE approach rates quality of evidence separately for each outcome, it is frequently the case that quality differs across outcomes. When determining the overall quality of evidence across outcomes:
Example 1: Rating overall quality of evidence based on the importance of outcomes
Several systematic reviews of high-quality randomised trials suggest a decrease in the incidence of infections and, likely, the mortality of ventilated patients in intensive care units receiving selective digestive decontamination (SDD). The quality of evidence on the effect of SDD on the emergence of bacterial antibiotic resistance and its clinical relevance is much less clear. One might reasonably grade the evidence about this feared potential adverse effect as low quality. If those making a recommendation felt that these downsides of therapy were critical, the overall grade of the quality of evidence for SDD would be low. If guideline panel felt that the emergence of bacterial antibiotic resistance was important but not critical, the grade for an overall quality of evidence would be high.
However, which outcomes are critical may depend on the evidence. On occasion, the overall confidence in effect estimates may not come from the outcomes judged critical at the beginning of the guideline development process – judgments about which outcomes are critical to the decision (recommendation) may change when considering the results. Note that such judgments require careful consideration and are probably rare.
There are 2 prototypical situations in which an outcome initially considered critical may cease to be critical once the evidence is summarized:
For instance, consider the following question: should statins vs. no statins be used in individuals without documented coronary heart disease but at high risk of cardiovascular events? Guideline developers are likely to start the process by considering outcomes: death from cardiovascular causes, myocardial infarction, stroke, and adverse effects, as critical to the decision.
A systematic review or randomized trials demonstrated consistent reductions in myocardial infarctions and stroke but nonsignificant reductions in coronary deaths. Serious adverse effects were unusual and readily reversible with drug discontinuation. The guideline authors found that for three of the four outcomes (myocardial infarction, stroke, and adverse effects) there was high quality evidence. For coronary deaths evidence was of moderate quality because of imprecision.
Should the overall quality of evidence across outcomes be high or moderate? The judgments made at the beginning of the process suggest that the answer is "moderate". However, once it is established that the risk of myocardial infarction and stroke decreases with statins, most people would find compelling reason to use statins. Knowing whether coronary mortality also decreases is no longer necessary for the decision (as long as it is very unlikely that it increases). Considering this, the overall rating of quality of evidence is most appropriately designated as "high".
The strength of a recommendation reflects the extent to which a guideline panel is confident that desirable effects of an intervention outweigh undesirable effects, or vice versa, across the range of patients for whom the recommendation is intended.
GRADE specifies two categories of the strength of a recommendation. While GRADE suggests using the terms strong and weak recommendations, those making recommendations may choose different wording to characterize the two categories of strength.
In special cases, guideline panels may recommend an intervention be used only in research until more data is generated, which would allow for a more comprehensive recommendation, or not make a recommendation at all.
There are limitations to formal grading of recommendations. Like the quality of evidence, the balance between desirable and undesirable effects reflects a continuum. Some arbitrariness will therefore be associated with placing particular recommendations in categories such as “strong” and “weak.” Most organisations producing guidelines have decided that the merits of an explicit grade of recommendation outweigh the disadvantages.
For a guideline panel or others making recommendations to offer a strong recommendation they have to be certain about the various factors that influence the strength of a recommendation. The panel also should have the relevant information at hand that supports a clear balance towards either the desirable effects of an intervention (to recommend an action) or undesirable effects (to recommend against an action).
When a guideline panel is uncertain whether the balance is clear or when the relevant information about the various factors that influence the strength of a recommendation is not available, a guideline panel should be more cautious and in most instances it would opt to make a weak recommendation.
Figure 3: Balance scales to depict strong vs. weak recommendations.
To aid interpretation GRADE suggests implications of strong or weak recommendations that follow from the recommendations. The advantage of two categories of strength of recommendations is that they provide clear direction to patients, clinicians, and policy-makers.
|
Table 6.1. Implications of strong and weak recommendations for different users of guidelines |
||
|
|
Strong Recommendation |
Weak Recommendation |
|
For patients |
Most individuals in this situation would want the recommended course of action and only a small proportion would not. |
The majority of individuals in this situation would want the suggested course of action, but many would not. |
|
For clinicians |
Most individuals should receive the recommended course of action. Adherence to this recommendation according to the guideline could be used as a quality criterion or performance indicator. Formal decision aids are not likely to be needed to help individuals make decisions consistent with their values and preferences. |
Recognize that different choices will be appropriate for different patients, and that you must help each patient arrive at a management decision consistent with her or his values and preferences. Decision aids may well be useful helping individuals making decisions consistent with their values and preferences. Clinicians should expect to spend more time with patients when working towards a decision. |
|
For policy makers |
The recommendation can be adapted as policy in most situations including for the use as performance indicators. |
Policy making will require substantial debates and involvement of many stakeholders. Policies are also more likely to vary between regions. Performance indicators would have to focus on the fact that adequate deliberation about the management options has taken place. |
Individualization of clinical decision-making in weak recommendations remains a challenge. Although clinicians always should consider patients’ preferences and values, when they face weak recommendations they may have more detailed conversations with patients than for strong recommendations to ensure that the ultimate decision is consistent with the patient’s preferences and values.
Important Note:
Clinicians, patients, third-party payers, institutional review committees, other stakeholders, or the courts should never view recommendations as dictates. Even strong recommendations based on high-quality evidence will not apply to all circumstances and all patients.
Users of guidelines may reasonably conclude that following some strong recommendations based on the high quality evidence will be a mistake for some patients. No clinical practice guideline or recommendation can take into account all of the often compelling unique features of individual patients and clinical circumstances. Thus, nobody charged with evaluating clinician’s actions, should attempt to apply recommendations by rote or in a blanket fashion.
A strong recommendation is one for which guideline panel is confident that the desirable effects of an intervention outweigh its undesirable effects (strong recommendation for an intervention) or that the undesirable effects of an intervention outweigh its desirable effects (strong recommendation against an intervention).
Note: Strong recommendations are not necessarily high priority recommendations.
A strong recommendation implies that most or all individuals will be best served by the recommended course of action.
Example 1: Sample strong recommendations
A weak recommendation is one for which the desirable effects probably outweigh the undesirable effects (weak recommendation for an intervention) or undesirable effects probably outweigh the desirable effects (weak recommendation against an intervention) but appreciable uncertainty exists.
A weak recommendation implies that not all individuals will be best served by the recommended course of action. There is a need to consider more carefully than usual the individual patient’s circumstances, preferences, and values. When there are weak recommendations caregivers need to allocate more time to shared decision making, making sure that they clearly and comprehensively explain the potential benefits and harms to a patient.
Alternative names for weak recommendations
Some have been concerned with the term “weak recommendation” experiencing an unintended negative connotation with the word “weak”, often also confusing it with “weak” evidence. To avoid confusion, weak recommendations can instead be described using the terms:
If any variations are used it is essential that authors exercise consistency across all recommendation in a guideline and across all guidelines they produce.
Promising interventions (usually new ones) with thus far insufficient evidence of benefit to support their use may be associated with appreciable harms or costs. Decision makers may worry about providing premature favorable recommendations for their use, encouraging the rapid diffusion of potentially ineffective or harmful interventions, and preventing recruitment to research already under way. They may be equally reluctant to recommend against such interventions out of fear that they will inhibit further investigation. By making recommendations for use of an intervention only in the context of research they may provide an important stimulus to efforts to answer important research questions, thus resolving uncertainty about optimal management.
Recommendations for using interventions only in research are appropriate when three conditions are met:
Recommendations for using interventions only in research should be accompanied by detailed suggestions about the specific research questions that should be addressed, particularly which patient-important outcomes they should measure. The recommendation for research may be accompanied by an explicit strong recommendation not to use the experimental intervention outside of the research context.
There are 3 reasons for which those making recommendations may be reluctant to make a recommendation for or against a particular management strategy, and also conclude that a recommendation to use the intervention only in research is not appropriate.
The third reason requires an explanation. Consider adult patients with thalassemia major considering hematopoietic cell transplantation (possibility of cure but an early mortality risk of 33%) vs. continued medical treatment with transfusion and iron chelation (continued morbidity and an uncertain prognosis). A guideline panel may consider that in such situations the only sensible recommendation is a discussion between patient and physician to ascertain the patient’s preferences.
Users of guidelines, however, may be frustrated with the lack of guidance when the guideline panel fails to make a recommendation. The USPSTF states: "Decision makers do not have the luxury of waiting for certain evidence. Even though evidence is insufficient, the clinician must still provide advice, patients must make choices, and policy makers must establish policies" [Petitti 2009; PMID: 19189910].
Clinicians themselves will rarely explore the evidence as thoroughly as a guideline panel, nor will they devote as much thought to the trade-offs, or the possible underlying values and preferences in the population. GRADE encourages panels to deal with their discomfort and to make recommendations even when confidence in effect estimate is low and/or desirable and undesirable consequences are closely balanced. Such recommendations will inevitably be weak, and may be accompanied by qualifications.
In the unusual circumstances in which panels may choose not to make a recommendation, they should specify the reason for this decision (see above).
Four key factors influence the direction and the strength of a recommendation (Table 6.2)
|
Table 6.2. Domains that contribute to the strength of a recommendation |
|
|
Domain |
Comment |
|
Balance between desirable and undesirable outcomes (trade-offs) taking into account: - best estimates of the magnitude of effects on desirable and undesirable outcomes - importance of outcomes (estimated typical values and preferences) |
The larger the differences between the desirable and undesirable consequences, the more likely a strong recommendation is warranted. The smaller the net benefit and the lower certainty for that benefit, the more likely a weak recommendation is warranted |
|
Confidence in the magnitude of estimates of effect of the interventions on important outcomes (overall quality of evidence for outcomes) |
The higher the quality of evidence, the more likely a strong recommendation is warranted |
|
Confidence in values and preferences and their variability |
The greater the variability in values and preferences, or uncertainty about typical values and preferences, the more likely a weak recommendation is warranted |
|
Resource use |
The higher the costs of an intervention (the more resources consumed), the less likely a strong recommendation is warranted |
Deciding about the balance between desirable and undesirable outcomes ("trade-offs") one considers two domains:
1. best estimates of the magnitude of desirable effects and the undesirable effects (summarized in evidence profiles)
2. importance of outcomes – typical values that patients or a population apply to those outcomes (“weight” of outcomes).
Large relative effects of an intervention consistently pointing in the same direction - towards desirable or towards undesirable effects are more likely to warrant a strong recommendation. Conversely, large relative effects of an intervention pointing in opposite directions - large desirable effects accompanied by large undesirable ones will lead to weak recommendations.
Large absolute effects are also more likely to lead to a strong recommendation, than small absolute effects. Baseline risk (control event rate) can influence the balance of desirable and undesirable outcomes. Large baseline risk differences will result in large differences in absolute effects of interventions. The strength of recommendations and its direction, therefore, will likely differ in high- and low-risk groups.
Examples
Large gradient between the desirable and undesirable effects (higher likelihood of a strong recommendation)
1. The very large gradient between the benefits of low dose aspirin on reductions in death and recurrent myocardial infarction and the undesirable consequences of minimal side effects and costs make a strong recommendation very likely.
Small gradient between the desirable and undesirable effects (higher likelihood of a weak recommendation)
1. Consider the choice of immunomodulating agents, namely cyclosporine or tacrolimus, in kidney transplant recipients. Tacrolimus results in better graft survival (a highly valued outcome), but at the important cost of a higher incidence of diabetes (the long-term complications of which can be devastating).
2. Patients with atrial fibrillation typically are more stroke averse than bleeding averse. If, however, the risk of stroke is sufficiently low, the trade-off between stroke reduction and increase in bleeding risk with anticoagulants is closely balanced.
Without considering the associated values and preferences, assessing large vs. small magnitude of effects may be misleading. Balancing the magnitude of desirable and undesirable outcomes requires considering weight (importance) of those outcomes that is determined by values and preferences.
Ideally, to inform estimates of typical patient values and preferences, guideline panels will conduct or identify systematic reviews of relevant studies of patient values and preferences. There is, however, paucity of empirical examinations of patients’ values and preferences.
Well resourced guideline panels will usually complement such studies with consultation with individual patients and patients’ groups. The panel should discuss whose values these people represent, namely representative patients, a defined subset of patients, or representatives of the general population.
Less well-resourced panels, without systematic reviews of values and preferences or consultation with patients and patient groups, must rely on unsystematic reviews of the available literature and their experience of interactions with patients. How well such estimates correspond to true typical values and preferences is likely to be uncertain.
Whatever the source of estimates of typical values and preferences, explicit, transparent statements of the panel’s choices are imperative (see 6.3.3 Providing transparent statements about assumed values and preferences).
For all outcomes considered, the GRADE process requires a rating describing the quality of evidence. Ultimately, guideline authors will form their recommendations based on their confidence in all effect estimates for each outcome considered critical to their recommendation and the quality of evidence. Quality of evidence ratings are determined by the eight already discussed; the five criteria that result in rating down the quality of evidence (study limitations, inconsistency, indirectness, imprecision, and publication bias result in rating down the quality of evidence whereas the remaining three criteria, lead to an increase in evidence quality; large magnitude of effect, dose-response gradient and when all plausible biases or confounders increase our confidence in the estimated effect.
Typically, a strong recommendation is associated with high, or at least moderate, confidence in the effect estimates for critical outcomes. If one has high confidence in effects on some critical outcomes (typically benefits), but low confidence in effects on other outcomes considered critical (often long-term harms), then a weak recommendation is likely warranted. Even when an apparently large gradient exists in the balance of desirable vs. undesirable outcomes, panels will be appropriately reluctant to offer a strong recommendation if their confidence in effect estimates for some critical outcomes is low.
For some questions, direct evidence about the effects on some critical outcomes may be lacking (e.g. quality of life has not been measured in any study). In such instances, even if well measured surrogates are available, confidence in estimates of effects on patient-important outcomes is very likely to be low.
Low confidence in effect estimates may, rarely, be tied to strong recommendations. In general, GRADE discourages guideline panels from making strong recommendations when their confidence in estimates of effect for critical outcomes is low or very low. GRADE has identified five paradigmatic situations in which strong recommendations may be warranted despite low or very low quality of evidence (Table 6.3). These situations can be conceptualized as ones in which a panel would have a low level of regret if subsequent evidence showed that their recommendation was misguided.
|
Table 6.3. Paradigmatic situations in which a strong recommendation may be warranted despite low or very low confidence in effect estimates |
||
|
Condition |
Example |
|
|
1 |
When low quality evidence suggests benefit in a life threatening situation (evidence regarding harms can be low or high) |
1. Fresh frozen plasma or vitamin K in a patient receiving warfarin with elevated INR and an intracranial bleed. Only low quality evidence supports the benefits of limiting the extent of the bleeding. 2. Amphotericin B vs. itraconazole in life threatening disseminated blastomycosis. High quality evidence suggests that amphotericin B is more toxic than itraconazole, and low quality evidence suggests that it reduces mortality in this context. |
|
2 |
When low quality evidence suggests benefit and high quality evidence suggests harm or a very high cost |
Head-to-toe CT/MRI screening for cancer. Low quality evidence of benefit of early detection but high quality evidence of possible harm and/or high cost (strong recommendation against this strategy) |
|
3 |
When low quality evidence suggests equivalence of two alternatives, but high quality evidence of less harm for one of the competing alternatives |
Helicobacter pylori eradication in patients with early stage gastric MALT lymphoma with H. pylori positive. Low quality evidence suggests that initial H. pylori eradication results in similar rates of complete response in comparison with the alternatives of radiation therapy or gastrectomy; high quality evidence suggests less harm/morbidity |
|
4 |
When high quality evidence suggests equivalence of two alternatives and low quality evidence suggests harm in one alternative |
Hypertension in women planning conception and in pregnancy. Strong recommendations for labetalol and nifedipine and strong recommendations against angiotensin converting enzyme (ACE) inhibitors and angiotensin receptor blockers (ARB) all agents have high quality evidence of equivalent beneficial outcomes, with low quality evidence for greater adverse effects with ACE inhibitors and ARBs |
|
5 |
When high quality evidence suggests modest benefits and low/very low quality evidence suggests possibility of catastrophic harm |
Testosterone in males with or at risk of prostate cancer. High quality evidence for moderate benefits of testosterone treatment in men with symptomatic androgen deficiency to improve bone mineral density and muscle strength. Low quality evidence for harm in patients with or at risk of prostate cancer |
|
INR – international normalized ratio; CT – computed tomography; MRI – magnetic resonance imaging; MALT – mucosa-associated lymphoid tissue. |
||
Uncertainty concerning values and preferences or their variability among patients may lower the strength of a recommendation.
As noted above, systematic study of patients’ values and preferences are very limited. Thus, panels will often be uncertain about typical values and preferences. The greater is the uncertainty, the more likely they will make a weak recommendation. Given the sparse systematic study of patients’ values and preferences, one could argue that large uncertainty always exists about the patients’ perspective. On the other hand, clinicians’ experience with patients may provide considerable additional insight. Indeed, on occasion, panels will, on the basis of clinical experience, be confident regarding typical patient’s values and preferences. Pregnant women’s strong aversion to even a small risk of important fetal abnormalities may be one such situation.
Large variability in values and preferences may also make a weak recommendation more likely. In such situations, it is less likely that a single recommendation would apply uniformly across all patients, and the right course of action is likely to differ between patients. Again, systematic research about variability in values and preferences is sparse. On the other hand, clinical experience may leave a panel confident that values and preferences differ widely among patients.
Example
1. A hopeful patient may place more emphasis on a small chance of benefit, whereas a pessimistic, risk-averse patient may place more emphasis on avoiding the risks associated with a potentially beneficial therapy. Some patients may have a belief that even if the risk of an adverse event is low, they will be the person who will suffer such an adverse effect. For instance, in patients with idiopathic pulmonary fibrosis, evidence for the benefit of steroids warrants only low confidence, whereas we can be very confident of a wide range of adverse effects associated with steroids. The hopeful patient with pulmonary fibrosis may be enthusiastic about use of steroids, whereas the risk-averse patient is likely to decline.
2. Thromboprophylaxis reduces the incidence of venous thromboembolism in immobile, hospitalized severely ill medical patients. Careful thromboprophylaxis has minimal side effects and relatively low cost while being very effective at preventing deep venous thrombosis and its sequelae. Peoples’ values and preferences are such that virtually all patients admitted to a hospital would, if they understood the choice they were making, opt to receive some form of thromboprophylaxis. Those making recommendations can thus offer a strong recommendation for thromboprophylaxis for patients in this setting.
3. A systematic review and meta-analysis describes a relative risk reduction (RRR) of approximately 80% in recurrent DVT for prophylaxis beyond 3 months up to one year. This large effect supports a strong recommendation for warfarin. Furthermore, the relatively narrow 95% confidence interval (approximately 74 to 88%) suggests that warfarin provides a RRR of at least 74%, and further supports a strong recommendation. At the same time, warfarin is associated with an inevitable burden of keeping dietary intake of vitamin K relatively constant, monitoring the intensity of anticoagulation with blood tests, and living with the increased risk of both minor and major bleeding. It is likely, however, that most patients would prefer avoiding another DVT and accept the risk of a bleeding episode. As a result, almost all patients with high risk of recurrent DVT would choose taking warfarin for 3 to 12 months, suggesting the appropriateness of a strong recommendation. Thereafter, there may be an appreciable number of patients who would reject life-long anticoagulation.
Panels may or may not consider resource use in their judgments about the direction and strength of recommendations. Reasons for not considering resource use include a lack of reliable data, the intervention is not useful and the effort of calculating resource use can be spared, the desirable effects so greatly outweigh any undesirable effects that resource considerations would not alter the final judgment, or they have elected (or been instructed) to leave resource considerations up to other decision makers. Panels should be explicit about the decision they made not to consider resource utilization and the reason for their decision.
If they elect to include resource utilization when making a recommendation, but have not included resource use as a consequence when preparing an evidence profile, they should be explicit about what types of resource use they considered when making the recommendation and whatever logic or evidence was used in their judgments.
Cost may be considered just another potentially important outcome – like mortality, morbidity, and quality of life – associated with alternative ways of managing patient problems. In addition to these clinical outcomes, however, an intervention may increase costs or decrease costs. The GRADE approach recommends that important or critical resource use be considered alongside other relevant outcomes in evidence profiles and summary of findings tables. It is important to use natural units when presenting resource use data as these can be applied in any setting.
Special considerations when incorporating resources use (cost) in recommendations:
There are several differences between costs and other outcomes:
1. With costs the issue of who pays and who gains is most prominent.
For most outcomes other than costs, it is clear that the patient and, secondarily, the patient’s family gains the advantages, and has to live with the disadvantages (this is not true of all outcomes – with vaccinations the entire community benefits from the herd effect, or widespread use of antibiotics may have down-stream adverse consequences of drug resistance). Health care costs are often borne by the society as a whole. Even within a society, who bears the cost may differ depending on the patient’s age or situation.
2. Attitudes about the extent to which costs should influence the decision differ depending on who bears the cost.
If costs are borne by the government, or a third party payer, some would argue that the physician’s responsibility to the patient means that costs should not influence the decision. On the other hand, a clinicians’ responsibility when caring for a patient is discharged in a broader context: resources that are used for an intervention cannot be used for something else and can affect the ability of the health system to best meet the needs of those it serves.
3. Costs tend to vary widely across jurisdictions or even within jurisdictions, and over time.
Costs of drugs are largely unrelated to the costs of production of those drugs, and more to marketing decisions and national policies. Hospitals or health maintenance organizations may, for instance, negotiate special arrangements with pharmaceutical companies for prices substantially lower than are available to patients or other providers. Even when resource use remains the same, the resource implications may vary widely across jurisdictions. Costs can also vary widely over time (e.g. when a drug comes off patent or a new, cheaper technology becomes available). The large variability in costs over time and jurisdictions requires that guideline panels formulate health care questions as specific as possible when bringing cost into the equation. The choice of comparator can be a particular problem in economic analyses. If the choice of the comparator is inappropriate (for instance, no treatment rather than an alternative though less effective intervention) conclusions may be misleading. Even when resource use remains the same, the resource implications may vary widely across jurisdictions. A year’s supply of a very expensive drug may pay a nurse’s salary in the United States, six nurses’ salaries in Poland, and 30 nurses’ salaries in China. Thus, what one can buy with the resources saved if one foregoes purchase of the drug (the “opportunity cost”) – and the health benefits achieved with those expenditures - will differ to a large extent.
4. People have different perspectives on the envelope in which they are considering opportunity costs.
A hospital pharmacy with a fixed budget considering purchase of an expensive new drug will have a clear idea of what that purchase will mean in terms of other medications the pharmacy cannot afford. People often assume the envelope is public health spending – funding a new drug or program will constrain resources for other public health expenditures. However, one may not be sure that refraining from that purchase really means that equivalent resources will be available for the health care system. Further, one may ask if the public health care is spending the correct envelope.
5. Resource allocation is a far more political issue than consideration of other outcomes.
Whether the guideline panel does or does not explicitly consider resource allocation issues, those politics may bear on a guideline panel’s function through conflict of interest.
Despite these differences, approaches to cost (resource use) are similar to other outcomes:
GRADE suggests that a broad perspective is desirable.
A recommendation could be intended for a very narrow audience, such as a single hospital pharmacy, an individual hospital or a health maintenance organization. Alternatively it could be intended for a health region, a country or an international audience.
Regardless of how narrow or broad the intended audience, guideline groups that choose to incorporate resource implications must be explicit about the perspective they are taking.
Alternatively a guideline may choose to take a societal perspective, and include all important resource implications, regardless of who bears the costs.
In a publicly funded health system the patient perspective would consider only resource implications that directly affect individual patients (e.g. out of pocket costs) and would ignore most of the costs generated (e.g. costs borne by the government). In European health care systems in which, for the most part, governments bear the cost of health care, expenses borne directly by patients will be minimal. A pharmacy perspective would ignore down-stream cost savings resulting for adverse events (e.g. stroke or myocardial infarction) prevented by a drug. A hospital perspective would ignore out-patient costs either incurred, or prevented. In the private sector, where disenrollment and loss of insurance can shift the burden of costs from one system to another, estimates of resource use should include the down-stream costs of all treated patients, not just those who remain in a particular health plan.
An even broader perspective, that of society, would include indirect costs or savings (e.g. lost wages). These are difficult to estimate and controversial because they assume that lost productivity will not be replaced by an individual who otherwise would be unemployed or underemployed, and implicitly place lower value on individuals not working (e.g. the retired). Taking a health systems perspective has another advantage. A comprehensive display of the resource use associated with alternative management strategies allows an individual or group – a patient, a pharmacy, or a hospital – to examine the relative merits of the alternatives from their particular perspective.
Clinicians seeing patients who are uncovered by either public or private insurance may need to help these individuals to make decisions taking into account their out of pocket costs. This is particularly true when clinical advantages and disadvantages are closely balanced, and there are substantial out of pocket costs. In these circumstances, if a guideline panel has used the GRADE approach and made evidence profiles available to the guideline users, clinicians can review evidence summaries and ensure that the patients’ decision to accept the recommended management strategy is consistent with their values and preferences – either though communicating the information directly to the patient, or by finding out what the patients’ situation and values and preferences are.
Evidence profiles and summary of findings tables should always present resource use, not just monetary values as monetary values for the same resource will vary depending on setting.
We suggest that guideline developers document best estimates of resource use, not best estimate of costs. Costs are a function of resources expended and the cost per unit of resource. Given the wide variability in costs per unit, reporting only total costs across broad categories of resource expenditure leaves users without the information required to judge whether estimates of unit costs apply to their setting. It is therefore recommended that natural units be used to estimate resource use. For example, required number of days stayed in hospital, the cost per night will vary depending on the setting.
Users of guidelines will be best informed if the guideline developers specify resources consumed by alternate management strategies, because they can:
Unless resource use is specified, users in settings other than that on which the analysts focus cannot estimate the associated incremental costs of the intervention.
Evidence of resource use may come from different sources than evidence of health benefits. This may be the case both because trials of interventions do not fully report resource use, because the trial situation may not fully reflect the circumstances (thus the resource use) that we would expect in clinical practice, because the relevant resource use may extend beyond the duration of trial, and because resource use may vary substantially across settings.
For resource use that is reported in the context of trials, criteria for quality assessment are identical to that of other outcomes. Just as for other outcomes of a trial, the quality of evidence may differ across different resources. For example, drug use may be relatively easy to estimate, whereas use of health professionals’ time may be more difficult, and the estimate of drug use may therefore be of higher quality.
A balance sheet (e.g. evidence profile) should inform judgments about whether the net benefits are worth the incremental costs. Balance sheets efficiently present the raw information required to make informed explicit judgments concerning resource use in guideline recommendations. However, when complex trade-off decisions involving several outcomes need to be made judgments may remain implicit or qualitatively described.
Pooling resource estimates from different studies is seldom as it can be quite controversial and should be carefully considered. However, authors can consider presenting pooled estimates of resource use when they are confident that the outcome in question has a common meaning (i.e. number of nights stayed in hospital) across the studies involved in analysis. Even in this case, it is recommended that authors adjust for geographical and temporal differences in cost.
Formal economic modeling may – or may not - be helpful.
Formal economic modeling results in cost per unit benefit achieved: cost per natural unit, such as cost per stroke prevented (cost-effectiveness analysis) cost per quality-adjusted life year gained (cost-utility analysis) cost and benefits valued in monetary values (cost-benefit analysis). These summaries can be helpful for informing judgments. Unfortunately, many published cost-effectiveness analyses have a high probability of being flawed or biased, and are setting-specific. When estimates of harms, benefits and resources used are based on low quality evidence, transparency of the economic model will be reduced and the model may be misleading.
Should guideline panels consider developing their own formal economic model?
Creating an economic model may be advisable if:
Modeling – while necessary for taking into account complexities and uncertainties in calculating cost per unit benefit – reduces transparency. Any model is only as good as the data on which it is based. When estimates of benefits, harms, or resources used come from low quality evidence, results of any economic modeling will be highly speculative.
Although criteria to assess the credence to give to results from statistical models of cost-effectiveness or cost-utility are available, these models generally include a large number of assumptions and varying quality evidence for the estimates that are included in the model. For these reasons, GRADE working group recommends not including cost-effectiveness or cost-utility models in evidence profiles. These models may, however, inform judgments of a guideline panel, or those of governments, or third part payers considering whether to include an intervention among their programs’ benefits.
Guideline panel may choose to explicitly consider or not to consider resource use in recommendations.
A guideline panel may legitimately choose to leave considerations of resource use aside, and offer a recommendation solely on the basis of other advantages and disadvantages of the alternatives being considered. Resource allocation must then be considered at the level of the ultimate decision-maker – be it the patient and healthcare professional, an organization (e.g. hospital pharmacy or a health maintenance organization), a third party payer, or a government. Guideline panels should be explicit about the decision to consider or not to consider resource utilization.
If guideline panel considers resource use it should, prior to bringing cost into the equation, first decide on the quality of evidence regarding other outcomes, and weigh up the advantages and disadvantages. Decisions regarding the importance of resource use issues will flow from this first step. For example, resource implications may be irrelevant if evidence of net health benefits is lacking. If advantages of an intervention far outweigh disadvantages, resource use is less likely to be important. Resource use usually becomes important when advantages and disadvantages are closely balanced.
GRADE approach suggests that panels considering resource use should offer only a single recommendation taking resource use into account. Panels should refrain from issuing two recommendations – one not taking resource use into account and a second doing so. Although this would have the advantage of explicitness on which GRADE places a very high value, GRADE working group is concerned that those with interests in dissemination of an intervention would effectively use only the recommendation ignoring resource implications as a weapon in their battle for funds (public funds, in particular).
Wording of a recommendation should offer clinicians as many indicators as possible for understanding and interpretation.
Recommendations should always answer the initial clinical question. Therefore, they should specify patients or population (characterized by the disease and other identifying factors) for whom the recommendation is intended and a recommended intervention as specifically and detailed as needed. Unless it is obvious, they should also specify the comparator. Sometimes, the recommendation may include a reference to the setting (e.g. primary or tertiary care, high- or low-income countries, etc.).
In general, it seems preferable to present recommendations in favor of a particular management approach rather than against an alternative. For instance, in considering the addition of aspirin to clopidogrel in patients who have had a stroke, it would be preferable to state: "In patients who have had a stroke, we suggest clopidogrel alone vs. adding aspirin to clopidogrel" rather than: "In patients who have had a stroke and are using clopidogrel, we suggest not adding aspirin". However, when a useless or harmful therapy is in wide use, recommendations against a management approach are appropriate. For instance, "In patients undergoing cardiac surgery who were not previously receiving beta blockers, we suggest not initiating perioperative beta blocker therapy".
Recommendations in the passive voice may lack clarity, therefore, GRADE suggest that guideline developers present recommendations in the active voice.
For strong recommendations, the GRADE working group has suggested adopting terminology, such as "we recommend..." or "clinicians should...", “clinicians should not…” or “Do…”, “Don’t…”
For weak recommendations, the GRADE working group has suggested less definitive wording, such as "we suggest..." or "clinicians might..." or “We conditionally recommend…” or “We make a qualified recommendation that…”.
Wording strong and weak recommendations is particularly important when guidelines are developed by international organizations and/or are intended for patients and clinicians in different regions, cultures, traditions, and usage of language. It is also crucial to explicitly and precisely consider wording when translating recommendations into different languages. Whatever terminology guideline panels choose to use to communicate the dichotomous nature of a recommendation, it is essential that they inform their users what the terms imply by providing the explanations as in Table 5.9.
Misinterpretation is possible however strength of recommendations is expressed. We suggest guideline developers consider using both words and symbols (which may be less confusing than numbers or letters) to express strength of recommendations.
A variety of presentations of quality of evidence and strength of recommendations may be appropriate. Most guideline panels have used letters and numbers to summarize their recommendations. Because of highly variable use of numbers and letters by different organizations this presentation may be confusing. Symbolic representations of the quality of evidence and strength of recommendations are appealing in that they are not burdened with this historical confusion. On the other hand, clinicians seem to be very comfortable with numbers and letters, which are particularly suitable for verbal communication, so there may be good reasons why organizations have chosen to use them.
The GRADE working group has decided to offer preferred symbolic representations, but users of guidelines based on the GRADE approach will often see numbers and letters being used to express the quality of evidence and strength of a recommendation.
|
Table 6.4. Suggested representations of quality of evidence and strength of recommendations |
||
|
Quality of Evidence |
Symbol |
Letter (varies) |
|
High |
⨁⨁⨁⨁ |
A |
|
Moderate |
⨁⨁⨁◯ |
B |
|
Low |
⨁⨁◯◯ |
C |
|
Very low |
⨁◯◯◯ |
D |
|
Strength of Recommendation |
Symbol |
Number |
|
Strong for an intervention |
↑↑ |
1 |
|
Weak for an intervention |
↑? |
2 |
|
Weak against an intervention |
↓? |
2 |
|
Strong against an intervention |
↓↓ |
1 |
Ideally, recommendations should be accompanied by a statement presenting assumptions about the values and preferences that underlie recommendations. For instance, a guideline addressing issues of thrombosis prevention and treatment in pregnancy noted: "Our recommendations reflect a belief that most women will place a low value on avoiding the pain, cost, and inconvenience of heparin therapy to avoid the small risk of even a minor abnormality in their child associated with warfarin prophylaxis".
In addition to, or in place of, making such general statements, guideline panels may provide statements associated with individual recommendations, especially those that are particularly sensitive to values and preferences. In such cases authors should place statements about underlying values and preferences with the recommendation statement rather than in the accompanying text. This prominent positioning of the statements will make it less likely that users of guidelines miss the importance of the values and preference judgments.
Consider, for instance, two groups that were part of a broader guideline effort made apparently contradictory recommendations regarding aspirin vs. clopidogrel in patients with atherosclerotic vascular disease, despite using the same underlying evidence from a trial that enrolled both patients with threatened stroke and those with peripheral vascular disease. One group focusing on stroke prevention recommended clopidogrel over aspirin stating: "This recommendation places a relatively high value on a small absolute risk reduction in stroke rates, and a relatively low value on minimizing drug expenditures". The other group focusing on the peripheral vascular disease recommended aspirin over clopidogrel, stating: "This recommendation places a relatively high value on avoiding large resource expenditures to achieve small reductions in vascular events". These recommendations suggest opposite courses of action. Both are appropriate given the stated values and preferences, which were made explicit in qualifying statements accompanying each recommendation.
Another way to frame values and preferences statements that panels may want to consider is in terms of patients who do not share the values and preferences underlying the recommendation. For instance, one may say: "For most healthy patients with achalasia undergoing an invasive procedure, we suggest minimally invasive surgical myotomy rather than pneumatic dilatation. Patients who prefer to avoid surgery and the high rates of gastroesophageal reflux disease seen after surgery, and who are willing to accept a higher initial failure rate and long-term recurrence rate, can reasonably choose pneumatic dilatation".
Ultimately, guideline panels must
integrate these determinants of direction and strength to make a
strong or weak recommendation for or against an intervention.
Table 6.2 presents the generic Evidence-to-Decision (EtD) table
that groups making recommendations may use to facilitate decision
making, record judgements, and document the process of going from
evidence to the decision. Table 6.3 presents an example of EtD
framework used in development of recommendations about the use of
ASA in patients with atrial fibrillation (PDF version).
Table 6.5. The Evidence-to-Decision
framework Evidence to Decisions
Framework: explanations Purpose of the
framework The purpose of this framework is
to help panels developing guidelines move from evidence to
recommendations. It is intended to: Development of the
framework The framework is being developed
as part of the
DECIDE project using an
iterative process informed by the
GRADE approach for going from
evidence to clinical recommendations, a review of relevant
literature, brainstorming, feedback from stakeholders,
application of the framework to examples, a survey of
policymakers, user testing, and trials. DECIDE (Developing
and Evaluating Communication Strategies to Support Informed
Decisions and Practice Based on Evidence) is a 5-year project
(running from January 2011 to 2015) co-funded by the European
Commission under the Seventh Framework Programme. DECIDE’s
primary objective is to improve the dissemination of
evidence-based recommendations by building on the work of the
GRADE Working Group to develop and evaluate methods that address
the targeted dissemination of guidelines. Description of the
framework The framework includes a
table with the
following columns: The framework also includes the
following conclusions that the panel
members must reach, which may include draft conclusions suggested
by the people who have prepared the framework: Flexibility The framework is flexible.
Organisations may elect to modify the terminology (and language)
that is used, the criteria, the response options and guidance for
using the framework to ensure that the framework is fit for
purpose. Use of the
framework Suggestions for how to use the
framework are provided in: Framework for going from evidence to a
recommendation – Guidance for health system and public health
recommendations, including
suggestions for preparing frameworks, supporting use of the
framework by guideline panels, and using the framework to support
well-informed decisions by guideline users. The final recommendation made by
the guideline panel is a consensus based on the judgements of the
panel members, informed by the evidence presented in the
framework and the panel members’ expertise and
experience. Explanations of the criteria
in the framework Why these criteria? The criteria included in the
framework are ones that have emerged from our literature review,
brainstorming, feedback from stakeholders, application of the
framework to examples, a survey of policymakers and user testing.
It is possible that we will make further modifications based on
continuing feedback, applications of the framework and user
testing. Guideline developers may also want to make
modifications, such as adding or removing criteria that are or
are not important for them to consider. However, there is clear
and consistent support for routinely including all of these
criteria and, up to now, a lack of clear and consistent support
for including other potential criteria. Detailed judgements The judgements that need to be
made are sometimes complex. Guideline panels are likely to find
it helpful to make and record detailed judgements for some
criteria using tables for detailed
judgements. This includes, for example,
detailed judgements about the size of the effect for each
outcome, the certainty of the evidence of the relative importance
of the outcomes and resource use, and important subgroup
considerations. Some criteria could be split into two or more
separate criteria and some panels may elect to do this in order
to highlight key considerations that are of particular importance
for their guidelines. For example, there are several reasons why
an option may not be acceptable to key stakeholders and these
could potentially be considered as separate criteria. From whose
perspective? Guideline panels should
explicitly state the perspective that they are taking when making
recommendations. This is especially important for determining
which costs (resource use) to consider. It can also influence
which outcomes and whose values are considered. For example,
out-of-pocket costs are important from the perspective of an
individual patient, whereas costs to the government are important
from the perspective of the government. Health system and public
health decisions are made on behalf of a population and a broad
perspective is required. However, because of their mandate, some
panels might take the perspective of the ministry of health or
health department, whereas other panels might take a societal
perspective (including all costs, regardless of who pays). Other
perspectives (the distribution of the benefits, harms and costs)
should be taken when considering the acceptability of the option
to key stakeholders. Large or small compared to
what? Some of the criteria imply a
comparison; for example, the size of effects or resource
requirements compared to
what? The comparisons or standards that
are used are likely to be different for different organisations,
guideline panels and jurisdictions. Some organisations or
guideline panels may elect to specify the comparisons or
standards that they will use. In the absence of such specified
comparisons, guideline panel members should consider what their
comparisons or standards are when they disagree, for example,
about whether resource requirements are large. When the
comparison being used is the source of their disagreement, they
should agree on an appropriate comparison and include this as an
additional consideration in the framework when it is
relevant. Guidance for making
judgements Suggestions for how to make
judgements in relation to each criterion are provided in
Framework for going
from evidence to a recommendation – Guidance for health system
and public health recommendations.
For each criterion there are four or five response options, from those that favour a recommendation against the option on the left to ones that favour a recommendation for the option on the right. In addition, most of the options include varies as a response option for situations when there is important variation across different settings for which the guidelines are intended and those differences are substantial enough that they might lead to different recommendations for different settings.
Questions to consider for each criterion and their relationship to a recommendation
For each criterion we suggest one or more detailed questions to consider when making a judgement and explain the relationship between the criterion and the recommendation.
|
Questions |
Explanations |
|
|
Is the problem a priority? |
Are the consequences of the problem serious (i.e. severe or important in terms of the potential benefits or savings)? Is the problem urgent? Is it a recognised priority (e.g. based on a national health plan)? Are a large number of people affected by the problem? |
The more serious a problem is, the more likely it is that an option that addresses the problem should be a priority (e.g., diseases that are fatal or disabling are likely to be a higher priority than diseases that only cause minor distress). The more people who are affected, the more likely it is that an option that addresses the problem should be a priority. |
|
Is there important uncertainty about how much people value the main outcomes? |
How much do those affected by the option value each of the outcomes in relation to the other outcomes (i.e. what is the relative importance of the outcomes)? Is there evidence to support those value judgements, or is there evidence of variability in those values that is large enough to lead to different decisions? |
The more likely it is that differences in values would lead to different decisions, the less likely it is that there will be a consensus that an option is a priority (or the more important it is likely to be to obtain evidence of the values of those affected by the option). Values in this context refer to the relative importance of the outcomes of interest (how much people value each of those outcomes). These values are sometimes called ‘utility values’. |
|
What is the overall certainty1 of the evidence of effectiveness? |
What is the overall certainty of this evidence of effects, across all of the outcomes that are critical to making a decision? |
The less certain the evidence is for critical outcomes (those that are driving a recommendation), the less likely that an option should be recommended (or the more important it is likely to be to conduct a pilot study or impact evaluation, if it is recommended). |
|
How substantial are the desirable anticipated effects? |
How substantial (large)are the desirable anticipated effects (including health and other benefits) of the option (taking into account the severity or importance of the desirable consequences and the number of people affected)? |
The larger the benefit, the more likely it is that an option should be recommended. |
|
How substantial are the undesirable anticipated effects? |
How substantial (large) are the undesirable anticipated effects (including harms to health and other harms) of the option (taking into account the severity or importance of the adverse effects and the number of people affected)? |
The greater the harm, the less likely it is that an option should be recommended. |
|
Do the desirable effects outweigh the undesirable effects? |
Are the desirable effects large relative to the undesirable effects? |
The larger the desirable effects in relation to the undesirable effects, taking into account the values of those affected (i.e. the relative value they attach to the desirable and undesirable outcomes) the more likely it is that an option should be recommended. |
|
How large are the resource requirements? |
How large an investment of resources would the option require or save? |
The greater the cost, the less likely it is that an option should be a priority. Conversely, the greater the savings, the more likely it is that an option should be a priority. |
|
How large is the incremental cost relative to the net benefit? |
Is the cost small relative to the net benefits (benefits minus harms)? |
The greater the cost per unit of benefit, the less likely it is that an option should be a priority. |
|
What would be the impact on health inequities? |
Would the option reduce or increase health inequities? |
Policies or programmes that reduce inequities are more likely to be a priority than ones that do not (or ones that increase inequities). |
|
Is the option acceptable to key stakeholders? |
Are key stakeholders likely to find the option acceptable (given the relative importance they attach to the desirable and undesirable consequences of the option; the timing of the benefits, harms and costs; and their moral values)? |
The less acceptable an option is to key stakeholders, the less likely it is that it should be recommended, or if it is recommended, the more likely it is that the recommendation should include an implementation strategy to address concerns about acceptability. Acceptability might reflect who benefits (or is harmed) and who pays (or saves); and when the benefits, adverse effects, and costs occur (and the discount rates of key stakeholders; e.g. politicians may have a high discount rate for anything that occurs beyond the next election). Unacceptability may be due to some stakeholders:
|
|
Is the option feasible to implement? |
Can the option be accomplished or brought about? |
The less feasible (capable of being accomplished or brought about) an option is, the less likely it is that it should be recommended (i.e. the more barriers there are that would be difficult to overcome). |
1 The “certainty of the evidence” is an assessment the likelihood that the effect will be substantially different from what the research found.
Explanations of the conclusions in the framework
Suggestions for how to make judgements in relation to each conclusion are provided in: Framework for going from evidence to a recommendation – Guidance for health system and public health recommendations. For each conclusion, we suggest one or more questions to consider when making a judgement and explain what is needed.
|
Term |
Question |
Explanation |
|
Overall judgement across all criteria |
What is the overall balance between all the desirable and undesirable consequences? |
An overall judgement whether the desirable consequences outweigh the undesirable consequences, or vice versa (based on all the research evidence and additional information considered in relation to all the criteria). Consequences include health and other benefits, adverse effects and other harms, resource use, and impacts on equity |
|
Type of recommendation |
Based on the balance of the consequences in relation to all of the criteria in the framework, what is your recommendation? |
A recommendation based on the balance of consequences and your judgements in relation to all of the criteria, for example:
|
|
Recommendation (text) |
What is your recommendation in plain language? |
A concise, clear and actionable recommendation |
|
Justification |
What is the justification for the recommendation, based on the criteria in the framework that drove the recommendation? |
A concise summary of the reasoning underlying the recommendation |
|
Subgroup considerations |
What, if any, subgroups were considered and what, if any, specific factors (based on the criteria in the framework) should be considered in relation to those subgroups when implementing the option? |
A concise summary of the subgroups that were considered and any modifications of the recommendation in relation to any of those subgroups |
|
Implementation considerations |
What should be considered when implementing the option, including strategies to address concerns about acceptability and feasibility? |
Key considerations, including strategies to address concerns about acceptability and feasibility, when implementing the option |
|
Monitoring and evaluation considerations |
What indicators should be monitored? Is there a need to evaluate the impacts of the option, either in a pilot study or an impact evaluation carried out alongside or before full implementation of the option? |
Any important indicators that should be monitored if the option is implemented |
|
Research priorities |
Are there any important uncertainties in relation to any of the criteria that are a priority for further research? |
Any research priorities |
Explanations of terms used in summaries of findings
|
Term |
Explanation |
|
These are all the outcomes (potential benefits or harms) that are considered to be important to those affected by the intervention, and which are important to making a recommendation or decision. Consultation with those affected by an intervention (such as patients and their carers) or other members of the public may be used to select the important outcomes. A review of the literature may also be carried out to inform the selection of the important outcomes. The importance (or value) of each outcome in relation to the other outcomes should also be considered. This is the relative importance of the outcome. |
|
|
95% Confidence Interval (CI) |
A confidence interval is a range around an estimate that conveys how precise the estimate is. The confidence interval is a guide to how sure we can be about the quantity we are interested in. The narrower the range between the two numbers, the more confident we can be about what the true value is; the wider the range, the less sure we can be. The width of the confidence interval reflects the extent to which chance may be responsible for the observed estimate (with a wider interval reflecting more chance). 95% Confidence Interval (CI) means that we can be 95 percent confident that the true size of effect is between the lower and upper confidence limit. Conversely, there is a 5 percent chance that the true effect is outside of this range. |
|
Relative Effect or RR (Risk Ratio) |
Here the relative effect is expressed as a risk ratio (RR). Risk is the probability of an outcome occurring. A risk ratio is the ratio between the risk in the intervention group and the risk in the control group. For example, if the risk in the intervention group is 1% (10 per 1000) and the risk in the control group is 10% (100 per 1000), the relative effect is 10/100 or 0.10. If the RR is exactly 1.0, this means that there is no difference between the occurrence of the outcome in the intervention and the control group. If the RR is greater than 1.0, the intervention increases the risk of the outcome. If it is a good outcome (for example, the birth of a healthy baby), a RR greater than 1.0 indicates a desirable effect for the intervention. Whereas, if the outcome is bad (for example, death) a RR greater than 1.0 would indicate an undesirable effect. If the RR is less than 1.0, the intervention decreases the risk of the outcome. This indicates a desirable effect, if it is a bad outcome (for example, death) and an undesirable effect if it is a good outcome (for example, birth of a healthy baby). |
|
Certainty of the evidence (GRADE)2 |
The certainty of the evidence is an assessment of how good an indication the research provides of the likely effect; i.e. the likelihood that the effect will be substantially different from what the research found. By substantially different we mean a large enough difference that it might affect a decision. This assessment is based on an overall assessment of reasons for there being more or less certainty using the GRADE approach. In the context of decisions, these considerations include the applicability of the evidence in a specific context. Other terms may be used synonymously with certainty of the evidence, including quality of the evidence, confidence in the estimate, and strength of the evidence. Definitions of the categories used to rate the certainty of the evidence (high, moderate, low, and very low) are provided in the table below. |
Definitions for ratings of the certainty of the evidence
|
Ratings |
Definitions |
|
High |
This research provides a very good indication of the likely effect. The likelihood that the effect will be substantially different is low. |
|
Moderate |
This research provides a good indication of the likely effect. The likelihood that the effect will be substantially different is moderate. |
|
Low |
This research provides some indication of the likely effect. However, the likelihood that it will be substantially different (a large enough difference that it might have an effect on a decision) is high. |
|
Very Low |
This research does not provide a reliable indication of the likely effect. The likelihood that the effect will be substantially different (a large enough difference that it might have an effect on a decision) is very high. |
Recommendations concerning diagnostic testing share the fundamental logic of recommendations for therapeutic and other interventions, such as screening. However, diagnostic questions also present unique challenges.
While some tests naturally report positive and negative results (e.g., pregnancy, HIV infection), other tests report their results as ordinal (e.g., Glasgow coma scale or mini-mental status examination) or continuous variable (e.g., metabolic measures), usually with increasing likelihood of disease or adverse events as the test results become more extreme. For simplicity, in this discussion we generally assume a diagnostic approach that ultimately categorizes test results as positive or negative. This also recognizes that many tests ultimately lead to dichotomized decisions to treat or not to treat.
Clinicians and researchers often administer diagnostic tests as a package or strategy composed of several tests. Thus, one can often think of evaluating or recommending a diagnostic strategy rather than a single test.
Examples
1. In managing patients with a diagnosis of cervical intraepithelial neoplasia, a precursor of prevent cervical cancer, based on visual inspection with acetic acid (VIA) clinicians may proceed to treatment directly or apply a strategy of testing for human papilloma virus and VIA.
2. Testing strategy may use an initial sensitive but non-specific test which, if positive, is followed by a more specific test (e.g., testing for HIV includes the use of an ELISA test followed by quantitative HIV RNA determination for those with positive results of the ELISA test; but one could ask the question why quantitative HIV RNA determination alone would not be appropriate).
The format of the question asked by authors of systematic reviews or guideline developers follows the same principles as the format for management questions:
- Should TEST A vs. TEST B be used in SOME PATIENTS/POPULATION?
- Should TEST A vs. TEST B be used for SOME PURPOSE?
Guideline panels should be explicit about the purpose of the test in question. Researchers and clinicians apply medical tests that are usually referred to as “diagnostic” – including signs and symptoms, imaging, biochemistry, pathology, and psychological testing – for a number of purposes. These applications include identifying physiological derangements, establishing prognosis, monitoring illness and treatment response, screening and diagnosis.
Guideline panels and authors of systematic reviews should also clearly establish the role of a diagnostic test or strategy. This process should begin with determining the standard diagnostic pathway – or pathways – for the target patient presentation and identify the associated limitations. Knowing those limitations one can identify particular shortcomings for which the alternative diagnostic test or strategy offers a putative remedy. The purpose of a test under consideration may be for (i) replacement (e.g., of tests with greater burden, invasiveness, cost, or inferior accuracy), (ii), triage (e.g., to minimize use of an invasive or expensive test) or (iii) add-on (e.g., to further enhance diagnostic accuracy beyond the existing diagnostic pathway) (Table 7.1) [Bossuyt 2006; PMID: 16675820].
Table 7.1. Possible roles of new diagnostic tests
|
Replacement |
A new test might substitute an old one, because it is more accurate, less invasive, less risky or uncomfortable for patients, organizationally or technically less challenging, quicker to yield results or more easily interpreted, or less costly. |
|
Triage |
A new test is added before the existing diagnostic pathway and only patients with a particular result on the triage test continue the testing pathway; triage tests are not necessarily more accurate but usually simpler and less costly. |
|
Add-on |
A new test is added after the existing diagnostic pathway and may be used to limit the number of either false positive or false negative results after the existing diagnostic pathway; add-on tests are usually more accurate but otherwise less attractive than existing tests. |
Clearly establishing the role or purpose of a test or test strategy will lead to the identification of sensible clinical questions that, similar to other management problems, have four components: patients, diagnostic intervention (strategy), comparison diagnostic intervention (strategy), and the outcomes of interest.
Examples
1: In patients suspected of coronary artery disease (patients) should multi-slice spiral computed tomography (CT) of coronary arteries (intervention) be used as replacement for conventional invasive coronary angiography (comparison) to lower complications with acceptable rates of false negatives associated with coronary events and false positives leading to unnecessary treatment and complications (outcomes)?
This example illustrates one common rationale for a new test – test replacement (coronary CT instead of conventional angiography) to avoid complications associated with a more invasive and expensive alternative for a condition that can effectively be treated. In this situation, the new test would only need to replicate the results of the existing test to demonstrate greater patient net benefit. This assumes that the new test similarly categorizes patients at the same stage of the disease and that the consequences of the test result, i.e. management decisions and outcomes, are similar.
2: In patients suspected of cow’s milk allergy (CMA), should skin prick tests rather than an oral food challenge with cow’s milk be used for the diagnosis and management of IgE-mediated CMA.
3: In adults cared for in a non-specialized clinical setting, should serum or plasma cystatin C rather than serum creatinine concentration be used for the diagnosis and management of renal impairment.
The concept of diagnostic accuracy relies on the presence of a so-called “gold standard”, i.e. a clearly stated definition of the target disease (i.e. construct of a disease). However, the term “gold standard” is ambiguous and not consistently defined. Moreover, constructs of diseases are constantly changing with progress in understanding biology (e.g. in oncology, with a more molecular understanding of the underlying pathologies or Alzheimer’s dementia). We will use the term “gold standard” here as representing the “perfect” approach to defining or diagnosing the disease or condition of interest, even if the approach is theoretical and based on convention. Following from this definition, diagnostic test accuracy (e.g. sensitivity and specificity) as a measurement property is not associated with a “gold standard”. We will use the term “reference standard” or reference test for the test or test strategy that is the current best and accepted approach to making a diagnosis against which a comparison (with an index test) may be made.
It follows that recommendations regarding the use of medical tests require inferences about the consequences of falsely identifying patients as having or not having the disease. If a test fails to improve patient-important outcomes there is no reason to use it, whatever its accuracy. Given the uncertainties about both reference and gold standards and the relation between diagnosis and patient or population consequences, the best way to assess a diagnostic test or strategy would be a test-treat randomized controlled trial in which investigators allocate patients to experimental or control diagnostic approaches and measure patient-important outcomes (mortality, morbidity, symptoms, quality of life and resource use).
|
Figure 1. Generic study designs that guideline developers can use to evaluate the impact of testing. |
|
|
|
|
|
Example Randomized controlled trials (RCTs) that explored a diagnostic strategy guided by the use of B-type natriuretic peptide (BNP) – designed to aid diagnosis of heart failure – compared with no use of BNP in patients presenting to the emergency department with acute dyspnea. As it turned out, the group randomized to receive BNP spent a shorter time in the hospital at lower cost with no increased mortality or morbidity. |
Example Consistent evidence from well designed studies demonstrates fewer false negative results with non-contrast helical CT than with intravenous pyelography (IVP) in the diagnosis of suspected acute urolithiasis. However, the stones in the ureter that CT detects but IVP “misses” are smaller, and hence are likely to pass more easily. Since RCTs evaluating the outcomes in patients treated for smaller stones are not available, the extent to which reduction in cases that are missed (false negatives) and follow-up of incidental findings unrelated to renal calculi with CT have important health benefits remains uncertain. |
|
Two generic ways in which one can evaluate a test or diagnostic strategy: a) Patients are randomized to a new test or strategy or, alternatively, to an old test or strategy. Those with a positive test (cases detected) are randomized (or were previously randomized) to receive the best available management (second step of randomization for management not shown in this figure). Investigators evaluate and compare patient-important outcomes in all patients in both groups. b) Patients receive both a new test and a reference test (it often, however, is the old or comparator test or strategy). Investigators can then calculate the accuracy of the test compared to the reference test (first step). To make judgments about patient-importance of this information, patients with a positive test (or strategy) in either group are (or have been in previous studies) submitted to treatment or no treatment; investigators then evaluate and compare patient-important outcomes in all patients in both groups (second step). |
|
When diagnostic intervention studies (RCTs or observational studies) comparing alternative diagnostic strategies with assessment of direct patient-important outcomes are available, guideline panels can use the GRADE approach for other interventions.
If studies measuring the impact of testing on patient-important or population-important outcomes are not available, guideline panels must focus on other studies, such as diagnostic test accuracy studies, and make inferences about the likely impact of using alternative tests on patient-important outcomes. In the latter situation, diagnostic accuracy can be considered a surrogate outcome for patient-important benefits and harms.
Key questions when using test accuracy as a surrogate are:
A recommendation associated with a diagnostic question follows from an evaluation of the balance between the desirable and undesirable consequences of the diagnostic test or strategy. It should be based on a systematic review addressing the clinical question as well as information about management after applying the diagnostic test.
Inferring from accuracy data that a diagnostic test or strategy improves patient-important outcome usually requires access to effective management. Alternatively, even with no effective treatment being available, using an accurate test may be beneficial, if it reduces adverse effects, cost or the anxiety through excluding an ominous diagnosis, or if confirming a diagnosis improves patient well-being from the prognostic information it imparts. Before drawing such inferences judgments about the confidence in diagnostic accuracy information is required.
As described above, when studies as described in Figure 1a are available, the approach to assessing the confidence in effect estimates (quality of evidence) described for other interventions in prior articles in this series should be used. The rest of the current article focuses on the situation when such direct data on patient-important outcomes are lacking and the body of evidence is derived from DTA studies. Thus, in this article, we will provide guidance for assessing the confidence in estimates for those synthesizing information from DTA studies, e.g. authors of systematic reviews. Summary of findings (SoF) tables and GRADE evidence profiles provide transparent accounts of this information by summarizing numerical information and ratings of the confidence in these estimates.
In a typical test accuracy study, a consecutive series of patients suspected for a particular condition are subjected to the index test (the test being evaluated) and then all patients receive a reference or gold standard (the best available method to establish the presence of the target condition). While in the GRADE approach appropriate accuracy studies (see below) start as high quality evidence about diagnostic accuracy, these studies are vulnerable to limitations and often lead to low quality evidence to support guideline recommendations, mostly owing to indirectness of evidence associated with diagnostic accuracy being only a surrogate for patient outcomes.
|
Table 7.2. Factors that decrease the quality of evidence for studies of diagnostic accuracy and how they differ from evidence for other interventions |
|
|
Factors that determine and can decrease the quality of evidence |
Explanations and how the factor may differ from the quality of evidence for other interventions |
|
Study design |
Different criteria for accuracy studies Cross-sectional or cohort studies in patients with diagnostic uncertainty and direct comparison of test results with an appropriate reference standard (best possible alternative test strategy) are considered high quality and can move to moderate, low or very low depending on other factors. |
|
Risk of bias (limitations in study design and execution) |
Different criteria for accuracy studies
|
|
Indirectness Patient population, diagnostic test, comparison test and indirect comparisons of tests |
Similar criteria The quality of evidence can be lowered if there are important differences between the populations studied and those for whom the recommendation is intended (in prior testing, the spectrum of disease or co-morbidity); if there are important differences in the tests studied and the diagnostic expertise of those applying them in the studies compared to the settings for which the recommendations are intended; or if the tests being compared are each compared to a reference (gold) standard in different studies and not directly compared in the same studies. Similar criteria Panels assessing diagnostic tests often face an absence of direct evidence about impact on patient-important outcomes. They must make deductions from diagnostic test studies about the balance between the presumed influences on patient-important outcomes of any differences in true and false positives and true and false negatives in relationship to test complications and costs. Therefore, accuracy studies typically provide low quality evidence for making recommendations due to indirectness of the outcomes, similar to surrogate outcomes for treatments. |
|
Important Inconsistency in study results |
Similar criteria For accuracy studies unexplained inconsistency in sensitivity, specificity or likelihood ratios (rather than relative risks or mean differences) can lower the quality of evidence. |
|
Imprecise evidence |
Similar criteria For accuracy studies wide confidence intervals for estimates of test accuracy, or true and false positive and negative rates can lower the quality of evidence. |
|
High probability of Publication bias |
Similar criteria A high risk of publication bias (e.g., evidence only from small studies supporting a new test, or asymmetry in a funnel plot) can lower the quality of evidence. |
|
Upgrading for dose effect, large effects residual plausible bias and confounding |
Similar criteria For all of these factors, methods have not been properly developed. However, determining a dose effect (e.g., increasing levels of anticoagulation measured by INR increase the likelihood for vitamin K deficiency or vitamin K antagonists). A very large likelihood of disease (not of patient-important outcomes) associated with test results may increase the quality evidence. However, there is some disagreement if and how dose effects play a role in assessing the quality of evidence in DTA studies. |
Several instruments for the evaluation of risk of bias in DTA studies are available. Cochrane Collaboration suggests a selection of the items from the QUADAS [Whiting 2003; PMID 14606960] and QUADAS-2 [Whiting 2011; PMID 22007046] instruments. Authors of systematic reviews and guideline panels can use the criteria from the QUADAS list (Table 7.3) to assess the risk of bias within and across studies.
Serious limitations in a body of evidence that indicate risk of bias, if found, will likely lead to downgrading the quality of evidence by one or two levels.
|
Table 7.3. Quality criteria of diagnostic accuracy studies derived from QUADAS (Reitsma 2009; http://srdta.cochrane.org/) |
|
|
1. |
Was the spectrum of patients representative of the patients who will receive the test in practice? (representative spectrum) |
|
2. |
Is the reference standard likely to classify the target condition correctly? (acceptable reference standard) |
|
3. |
Is the time period between reference standard and index test short enough to be reasonably sure that the target condition did not change between the two tests? (acceptable delay between tests) |
|
4. |
Did the whole sample or a random selection of the sample, receive verification using the intended reference standard? (partial verification avoided) |
|
5. |
Did patients receive the same reference standard irrespective of the index test result? (differential verification avoided) |
|
6. |
Was the reference standard independent of the index test (i.e. the index test did not form part of the reference standard)? (incorporation avoided) |
|
7. |
Were the reference standard results interpreted without knowledge of the results of the index test? (index test results blinded) |
|
8. |
Were the index test results interpreted without knowledge of the results of the reference standard? (reference standard results blinded) |
|
9. |
Were the same clinical data available when test results were interpreted as would be available when the test is used in practice? (relevant clinical information) |
|
10. |
Were uninterpretable/intermediate test results reported? (uninterpretable results reported) |
|
11. |
Were withdrawals from the study explained? (withdrawals explained) |
|
Table 7.4. Quality criteria of diagnostic accuracy studies derived from QUADAS-2 |
||||
|
Domain |
Patient Selection |
Index Test |
Reference Standard |
Flow and Timing |
|
Description |
Describe methods of patient selection Describe included patients (previous testing, presentation, intended use of index test, and setting) |
Describe the index test and how it was conducted and interpreted |
Describe the reference standard and how it was conducted and interpreted |
Describe any patients who did not receive the index tests or reference standard or who were excluded from the 2 X 2 table (refer to flow diagram) Describe the interval and any interventions between index tests and the reference standard |
|
Signaling questions (yes, no, or unclear) |
Was a consecutive or random sample of patients enrolled? Was a case–control design avoided? Did the study avoid inappropriate exclusions? |
Were the index test results interpreted without know- ledge of the results of the reference standard? If a threshold was used, was it pre-specified? |
Is the reference standard likely to correctly classify the target condition? Were the reference standard results interpreted without knowledge of the results of the index test? |
Was there an appropriate interval between index tests and reference standard? Did all patients receive a reference standard? Did all patients receive the same reference standard? Were all patients included in the analysis? |
|
Risk of bias (high, low, or unclear) |
Could the selection of patients have introduced bias? |
Could the conduct or interpretation of the index test have introduced bias? |
Could the reference standard, its conduct, or its interpretation have introduced bias? |
Could the patient flow have introduced bias? |
Judging indirectness of the evidence presents additional and probably greater challenges for authors of systematic reviews of diagnostic test accuracy and for guideline panels making recommendations about diagnostic tests. First, as with therapeutic interventions, indirectness must be assessed in relation to the population, setting, the intervention (the new or index test) and the comparator (another investigated test or the reference standard). For instance, a judgment of indirectness of the population can result from using a different test setting such as the patients seen in an emergency department may differ from patients seen in a general practitioner office, the patients included in the studies of interest may differ or the target condition of the population is not the same in the studies compared to the question asked.
If the clinical question is about the choice between two tests, neither of which is a reference standard, one needs to assess whether the two tests were compared directly against each other and the reference test in the same study, or in separate studies in which each test was compared separately against the reference standard. For example, a systematic review comparing the diagnostic accuracy of two tests for renal insufficiency – serum creatinine and serum cystatin C – identified a number of studies that performed serum tests for both creatinine and cystatin C and the reference standard in the same patients (Table 7.5).
Table 7.5. Diagnostic accuracy SoF table: cystatin vs. creatinine in diagnosis of renal failure
Unlike for management questions, if only diagnostic accuracy information is available, the assessment of indirectness requires additional judgments about how the correct and incorrect classification of subjects as having or not having a target condition relates to patient important outcomes. While authors of systematic reviews will frequently skip this assessment because their interest may relate only to the review of the diagnostic accuracy, guideline panels must always make this judgment – either implicitly or, better, explicitly and transparently.
Although these criteria are applicable to a body of evidence from studies of diagnostic test accuracy, the methods to determine whether a particular criterion is met are less well established compared with the evidence about the effects of therapeutic interventions. Further theoretical and empirical work is required to provide guidance how to assess those criteria.
Tables 7.6 and 7.7 show the assessment of the confidence in the estimates and the SoF table of all critical outcomes for the comparison of computed tomography (CT) angiography with an invasive angiography (the reference standard) in patients suspected of coronary artery disease.
Table 7.6. . Quality assessment of diagnostic accuracy studies – example: should multi-slice spiral computed tomography instead of conventional coronary angiography be used for diagnosis of coronary artery disease?
Table 7.7. . Summary of findings of all critical outcomes for the comparison of computed tomography (CT) angiography with an invasive angiography (the reference standard) in patients suspected of coronary artery disease.
The original accuracy studies were well planned and executed, the results are precise, and one does not suspect relevant publication bias. However, there are problems with inconsistency. Reviewers addressing the relative merits of CT versus invasive angiography for diagnosis of coronary disease found important heterogeneity in the results for the proportion of invasive angiography-negative patients with a positive CT test result (specificity) and in the results for the proportion of angiography-positive patients with a negative CT test result (sensitivity) that they could not explain (Figure 2). This heterogeneity was also present for other measures of diagnostic test accuracy (i.e. positive and negative likelihood ratios and diagnostic odds ratios). Unexplained heterogeneity in the results across studies reduced the quality of evidence for all outcomes.
|
Figure 2. Example for heterogeneity in diagnostic test results |
|
|
|
Sensitivity and specificity of multi-slice coronary CT compared with coronary angiogram (from reference 4). This heterogeneity also existed for likelihood ratios and diagnostic odds ratios. |
One of the aims of the GRADE Working Group is to reduce unnecessary confusion arising from multiple systems for grading quality of evidence and strength of recommendations. To avoid adding to this confusion by having multiple variations of the GRADE system we suggest that the criteria below should be met when saying that the GRADE approach was used. Also, while users may believe there are good reasons for modifying the GRADE system, we discourage the use of “modified” GRADE approaches that differ substantially from the approach described by the GRADE Working Group.
However, we encourage and welcome constructive criticism of the GRADE approach, suggestions for improvements, and involvement in the GRADE Working Group. As most scientific approaches to advancing healthcare, the GRADE approach will continue to evolve in response to new research and to meet the needs of authors of systematic reviews, guideline developers and other users.
Checklist: Suggested criteria for stating that the GRADE system was used
Disclaimer: Section 8 has been updated in the new GRADE Book and is available here: https://book.gradepro.org/guideline/requirements-for-claiming-the-use-of-grade
One of the aims of the GRADE Working Group is to reduce unnecessary confusion arising from multiple systems for grading quality of evidence and strength of recommendations. To avoid adding to this confusion by having multiple variations of the GRADE system we suggest that the criteria below should be met when saying that the GRADE approach was used. Also, while users may believe there are good reasons for modifying the GRADE system, we discourage the use of “modified” GRADE approaches that differ substantially from the approach described by the GRADE Working Group.
However, we encourage and welcome constructive criticism of the GRADE approach, suggestions for improvements, and involvement in the GRADE Working Group. As most scientific approaches to advancing healthcare, the GRADE approach will continue to evolve in response to new research and to meet the needs of authors of systematic reviews, guideline developers and other users.
Checklist: Suggested criteria for stating that the GRADE system was used
This glossary is partially based on the glossary of the Cochrane Collaboration and the Users' Guides to the Medical Literature with permission.
Absolute risk reduction (ARR): Synonym of the risk difference (RD). The difference in the risk between two groups. For example, if one group has a 15% risk of contracting a particular disease, and the other has a 10% risk of getting the disease, the risk difference is 5 percentage points.
Baseline risk: synonym of control group risk.
Bias: A systematic error or deviation in results or inferences from the truth. In studies of the effects of health care, the main types of bias arise from systematic differences in the groups that are compared (selection bias), the care that is provided, exposure to other factors apart from the intervention of interest (performance bias), withdrawals or exclusions of people entered into a study (attrition bias) or how outcomes are assessed (detection bias). Systematic reviews of studies may also be particularly affected by reporting bias, where a biased subset of all the relevant data is available.
Burden: ;Burdens are the demands that patients or caregivers (e.g. family) may dislike, such as having to take medication or the inconvenience of going to the doctor’s office.
Case series: A study reporting observations on a series of individuals, usually all receiving the same intervention, with no control group.
Case report: A study reporting observations on a single individual. Also called: anecdote, case history, or case study.
Case-control study: An observational study that compares people with a specific disease or outcome of interest (cases) to people from the same population without that disease or outcome (controls), and which seeks to find associations between the outcome and prior exposure to particular risk factors. This design is particularly useful where the outcome is rare and past exposure can be reliably measured. Case-control studies are usually retrospective, but not always.
Categorical data: Data that are classified into two or more non-overlapping categories. Gender and type of drug (aspirin, paracetamol, etc.) are examples of categorical variables.
Clinical practice guideline (CPG): A systematically developed statement to assist practitioner and patient decisions about appropriate health care for specific clinical circumstances.
Cohort study: An observational study in which a defined group of people (the cohort) is followed over time. The outcomes of people in subsets of this cohort are compared, to examine people who were exposed or not exposed (or exposed at different levels) to a particular intervention or other factor of interest. A prospective cohort study assembles participants and follows them into the future. A retrospective (or historical) cohort study identifies subjects from past records and follows them from the time of those records to the present.
Comparison: intervention against which new intervention is compared, control group.
Confidence interval (CI): A measure of the uncertainty around the main finding of a statistical analysis. Estimates of unknown quantities, such as the RR comparing an experimental intervention with a control, are usually presented as a point estimate and a 95% confidence interval. This means that if someone were to keep repeating a study in other samples from the same population, 95% of the calculated confidence intervals from those studies would include the true underlying value. Conceptually easier than this definition is to think of the CI as the range in which the truth plausibly lies. Wider intervals indicate less precision; narrow intervals, greater precision. Alternatives to 95%, such as 90% and 99% confidence intervals, are sometimes used.
Confounder: A factor that is associated with both an intervention (or exposure) and the outcome of interest. For example, if people in the experimental group of a controlled trial are younger than those in the control group, it will be difficult to decide whether a lower risk of death in one group is due to the intervention or the difference in ages. Age is then said to be a confounder, or a confounding variable. Randomisation is used to minimise imbalances in confounding variables between experimental and control groups. Confounding is a major concern in non-randomised studies.
Consumer (healthcare consumer): Someone who uses, is affected by, or who is entitled to use a health related service.
Context: The conditions and circumstances that are relevant to the application of an intervention, for example the setting (in hospital, at home, in the air); the time (working day, holiday, night-time); type of practice (primary, secondary, tertiary care; private practice, insurance practice, charity); whether routine or emergency. Also called clinical situation.
Continuous data: Data with a potentially infinite number of possible values within a given range. Height, weight and blood pressure are examples of continuous variables.
Control: In a controlled trial a control is a participant in the arm that acts as a comparator for one or more experimental interventions. Controls may receive placebo, no treatment, standard treatment, or an active intervention, such as a standard drug. In an observational study a control is a person in the group without the disease or outcome of interest.
Control Group Risk: observed risk of the event in the control group. Synonym of baseline risk. The control group risk for an outcome is calculated by dividing the number of people with an outcome in control group by the total number of participants in the control group.
Critical appraisal: The process of assessing and interpreting evidence by systematically considering its validity, results, and relevance.
Desirable effect: A desirable effect of adherence to a recommendation can include beneficial health outcomes, less burden and savings.
Dose response gradient: The relationship between the quantity of treatment given and its effect on outcome.
Effect size (ES): A generic term for the estimate of effect of treatment for a study. Sometimes the term is used to refer to the standardized mean difference.
To facilitate understanding we suggest interpretation of the effect size offered by Cohen (Cohen J. Statistical Power Analysis for the Behavioral Sciences. 2nd ed; 1988). According to this interpretation, an effect size or standardized mean difference of around:
Effectiveness: The extent to which an intervention produces a beneficial result under ideal conditions. Clinical trials that assess effectiveness are sometimes called pragmatic or management trials.
Efficacy: The extent to which an intervention produces a beneficial result under ideal conditions. Clinical trials that assess efficacy are sometimes called explanatory trials.
Estimate of effect: The observed relationship between an intervention and an outcome expressed as, for example, a number needed to treat, odds ratio, risk difference, risk ratio, relative risk reduction, standardised mean difference, or weighted mean difference.
External validity: The extent to which results provide a correct basis for generalisations to other circumstances. For instance, a meta-analysis of trials of elderly patients may not be generalizable to children. Also calledgeneralizability or applicability.
Follow-up: The observation over a period of time of study/trial participants to measure outcomes under investigation.
Hazard ratio (HR): A measure of effect produced by a survival analysis and representing the increased risk with which one group is likely to experience the outcome of interest. For example, if the hazard ratio for death for a treatment is 0.5, then we can say that treated patients are likely to die at half the rate of untreated patients.
Intention to treat analysis (ITT): A strategy for analysing data from a randomised controlled trial. All participants are included in the arm to which they were allocated, whether or not they received (or completed) the intervention given to that arm. Intention-to-treat analysis prevents bias caused by the loss of participants, which may disrupt the baseline equivalence established by randomisation and which may reflect non-adherence to the protocol. The term is often misused in trial publications when some participants were excluded.
Internal validity: The extent to which the design and conduct of a study are likely to have prevented bias. Variation in methodological quality can explain variation in the results of studies. More rigorously designed (better quality) trials are more likely to yield results that are closer to the truth.
Intervention: The process of intervening on people, groups, entities, or objects in an experimental study. In controlled trials, the word is sometimes used to describe the regimens in all comparison groups, including placebo and no-treatment arms.
Mean difference (MD): the ‘difference in means’ is a standard statistic that measures the absolute difference between the mean value in the two groups in a clinical trial. It estimates the amount by which the treatment changes the outcome on average. It can be used as a summary statistic in meta-analysis when outcome measurements in all trials are made on the same scale. Previously referred to as weighted mean difference (WMD).
Meta-analysis: The statistical combination of results from two or more separate studies.
Minimally important difference (MID): The smallest difference in score in the outcome of interest that informed patients or informed proxies perceive as important, either beneficial or harmful, and that would lead the patient or clinician to consider a change in the management.
Number needed to treat (NNT): An estimate of how many people need to receive a treatment before one person would experience a beneficial outcome. For example, if you need to give a stroke prevention drug to 20 people before one stroke is prevented, then the number needed to treat to benefit for that stroke prevention drug is 20. It is estimated as the reciprocal of the risk difference.
Number needed to harm (NNH): A number needed to treat to benefit associated with a harmful effect. It is an estimate of how many people need to receive a treatment before one more person would experience a harmful outcome or one fewer person would experience a beneficial outcome.
Observational study: A study in which the investigators do not seek to intervene, and simply observe the course of events. Changes or differences in one characteristic (e.g. whether or not people received the intervention of interest) are studied in relation to changes or differences in other characteristic(s) (e.g. whether or not they died), without action by the investigator. There is a greater risk of selection bias than in experimental studies.
Odds ratio (OR): The ratio of the odds of an event in one group to the odds of an event in another group. In studies of treatment effect, the odds in the treatment group are usually divided by the odds in the control group. An odds ratio of one indicates no difference between comparison groups. For undesirable outcomes an OR that is less than one indicates that the intervention was effective in reducing the risk of that outcome. When the risk is small, the value of odds ratio is similar to risk ratio. When the events in the control group are not frequent, OR and HR can be assumed to be equal to the RR for the application of this criterion.
Optimal information size (OIS): number of patients generated by a conventional sample size calculation for a single trial.
Outcome: A component of a participant's clinical and functional status after an intervention has been applied, that is used to assess the effectiveness of an intervention.
Point estimate: The results (e.g. mean, weighted mean difference, odds ratio, risk ratio or risk difference) obtained in a sample (a study or a meta-analysis) which are used as the best estimate of what is true for the relevant population from which the sample is taken.
Population: The group of people being studied, usually by taking samples from that population. Populations may be defined by any characteristics e.g. geography, age group, certain diseases.
Precision: A measure of the likelihood of random errors in the results of a study, meta-analysis or measurement. The less random error the greater the precision. Confidence intervals around the estimate of effect from each study are one way of expressing precision, with a narrower confidence interval meaning more precision.
Quality of evidence: The extent to which one can be confident that an estimate of effect is correct.
Randomised controlled trial (RCT): An experimental study in which two or more interventions are compared by being randomly allocated to participants. In most trials one intervention is assigned to each individual but sometimes assignment is to defined groups of individuals (for example, in a household) or interventions are assigned within individuals (for example, in different orders or to different parts of the body).
Relative risk (RR): Synonym of risk ratio. The ratio of risks in two groups. In intervention studies, it is the ratio of the risk in the intervention group to the risk in the control group. A risk ratio of one indicates no difference between comparison groups. For undesirable outcomes, a risk ratio that is less than one indicates that the intervention was effective in reducing the risk of that outcome.
Relative risk reduction (RRR): The proportional reduction in risk in one treatment group compared to another. It is one minus the risk ratio. If the risk ratio is 0.25, then the relative risk reduction is 1-0.25=0.75, or 75%.
Review Manager (RevMan): Software used for preparing and maintaining Cochrane systematic reviews. RevMan allows you to write ad manage systematic review protocols, as well as complete reviews, including text, tables, and study data. It can perform meta-analysis of the data entered, and present the results graphically.
Risk: The proportion of participants experiencing the event of interest. Thus, if out of 100 participants the event (e.g. a stroke) is observed in 32, the risk is 0.32. The control group risk is the risk amongst the control group. The risk may sometimes be referred to as the event rate.
Standardised mean difference (SMD): The difference between two estimated means divided by an estimate of the standard deviation. It is used to combine results from studies using different ways of measuring the same continuous variable, e.g. pain. By expressing the effects as a standardised value, the results can be combined since they have no units. Standardised mean differences are sometimes referred to as a d index.
Statistically significant: A result that is unlikely to have happened by chance. The usual threshold for this judgement is that the results, or more extreme results, would occur by chance with a probability of less than 0.05 if the null hypothesis was true. Statistical tests produce a p-value used to assess this.
Strength of a recommendation: The degree of confidence that the desirable effects of adherence to a recommendation outweigh the undesirable effects.
Surrogate outcome: Outcome measure that is not of direct practical importance but is believed to reflect an outcome that is important; for example, blood pressure is not directly important to patients but it is often used as an outcome in clinical trials because it is a risk factor for stroke and heart attacks. Surrogate outcomes are often physiological or biochemical markers that can be relatively quickly and easily measured, and that are taken as being predictive of important clinical outcomes. They are often used when observation of clinical outcomes requires long follow-up. Also called: intermediary outcomes or surrogate endpoints.
Systematic review: A review of a clearly formulated question that uses systematic and explicit methods to identify, select, and critically appraise relevant research, and to collect and analyse data from the studies that are included in the review. Statistical methods (meta-analysis) may or may not be used to analyse and summarise the results of the included studies.
Undesirable effect: An undesirable effect of adherence to a recommendation can include harms, more burden, and costs.
The following is a collection of published documents about the GRADE approach.
Introductory series published in the BMJ (2008)
Series of articles with examples from the field of allergy published in Allergy (2010)
Series of detailed articles for authors of guidelines and systematic reviews published in JCE (2011-2014)
Reproducibility of the GRADE approach (2013)
The GRADE approach is reproducible in assessing the quality of evidence of quantitative evidence syntheses | PDF | PubMed
GRADE Repository
The collection and map of current, up-to-date sources of GRADE guidance and concepts. It is intended to support ongoing research, evidence synthesis, and teaching activities related to the GRADE approach. https://book.gradepro.org/map/grade-repository | LINK |
Resources for authors of systematic reviews
The Cochrane Handbook
The Cochrane Handbook includes two principle chapters which provide information on how to create Summary of Findings tables using the information from Cochrane systematic reviews and GRADEing the evidence.
Part 2 Chapter 11: Presenting results and ‘Summary of findings’ tables
Part 2 Chapter 12: Interpreting results and drawing conclusions
General evidence-based medicine resources
The Cochrane Library
The Cochrane Library contains high-quality, independent evidence to inform healthcare decision-making. It includes reliable evidence from Cochrane and other systematic reviews, clinical trials, and more. Cochrane reviews bring you the combined results of the world’s best medical research studies, and are recognised as the gold standard in evidence-based health care.
The Cochrane Handbook
The Cochrane Handbook for Systematic Reviews of Interventions (the Handbook) provides guidance to authors for the preparation of Cochrane Intervention reviews (including Cochrane Overviews of reviews). The Handbook is updated regularly to reflect advances in systematic review methodology and in response to feedback from users.
Users' Guides to the Medical Literature
A complete set of Users' Guides to find, evaluate and use medical literature which were originally published as a series in the Journal of the American Medical Association (JAMA).
Users' Guides to the Medical Literature: A Manual for Evidence-Based Clinical Practice (Interactive) presents the sophisticated concepts of evidence-based medicine (EBM) in unique ways that can be used to determine diagnosis, decide optimal therapy, and predict prognosis. It also offers in-depth expansion of methodology, statistics, and cost issues that emerge in medical research.
Guideline specific resources
Improving the use of research evidence in guideline development (SERIES)
A series of 16 papers published in Health Research Policy and Systems in 2006, Volume 4, Issues 12 to 28 about guideline development. Topics are Guidelines for guidelines, Priority setting, Group composition and consultation process, Managing conflicts of interest, Group processes, Determining which outcomes are important, Deciding what evidence to include, Synthesis and presentation of evidence, Grading evidence and recommendations, Integrating values and consumer involvement, Incorporating considerations of cost-effectiveness, affordability and resource implications, Incorporating considerations of equity, Adaptation, applicability and transferability, Reporting guidelines, Disseminating and implementing guidelines, and Evaluation.
The AGREE instrument
The purpose of the Appraisal of Guidelines Research & Evaluation (AGREE) Instrument is to provide a framework for assessing the quality of clinical practice guidelines.
GRADE Working Group
The Grading of Recommendations Assessment, Development and Evaluation (short GRADE) Working Group began in the year 2000 as an informal collaboration of people with an interest in addressing the shortcomings of present grading systems in health care. Our aim is to develop a common, sensible approach to grading quality of evidence and strength of recommendation.
Guidelines Advisory Committee
The Guidelines Advisory Committee (GAC) is an independent partnership of the Ontario Medical Association and the Ontario Ministry of Health and Long Term Care (MOHLTC). The GACs mission is to promote better health for the people of Ontario by encouraging physicians and other practitioners to use evidence-based clinical practice guidelines and clinical practices based on best available evidence. We identify, evaluate, endorse and summarize guidelines for use in Ontario.
National Guideline Clearing House
The National Guideline Clearinghouse (NGC) is a comprehensive database of evidence-based clinical practice guidelines and related documents. NGC is an initiative of the Agency for Healthcare Research and Quality (AHRQ), U.S. Department of Health and Human Services.
National Library of Guidelines
The National Library of Guidelines is a collection of guidelines for the NHS. It is based on the guidelines produced by NICE and other national agencies. The main focus of the Library is on guidelines produced in the UK, but where no UK guideline is available, guidelines from other countries are included in the collection.
The Grading of Recommendations Assessment, Development and Evaluation (GRADE) Working Group began in the year 2000 as an informal collaboration of more than 60 methodologists, clinicians, systematic reviewers, and guideline developers representing various organizations with the goal to address shortcomings of present grading systems in health care. The aim was to develop a common, sensible approach to grading quality of evidence and strength of recommendations. Based on shared experience, a critical review of other systems, and working through examples and applying the system in guidelines, the Working Group has developed the GRADE approach as a common, transparent and sensible method to grading quality of evidence and strength of recommendations.
Several organizations that are now using or endorsing the GRADE approach in its original format or with minor modifications:
[INSERT LIST OF ORGANIZATIONS]